Executive Summary
| Transparency | Replicability | Clarity |
|---|---|---|
4 of 4 findings replicated |
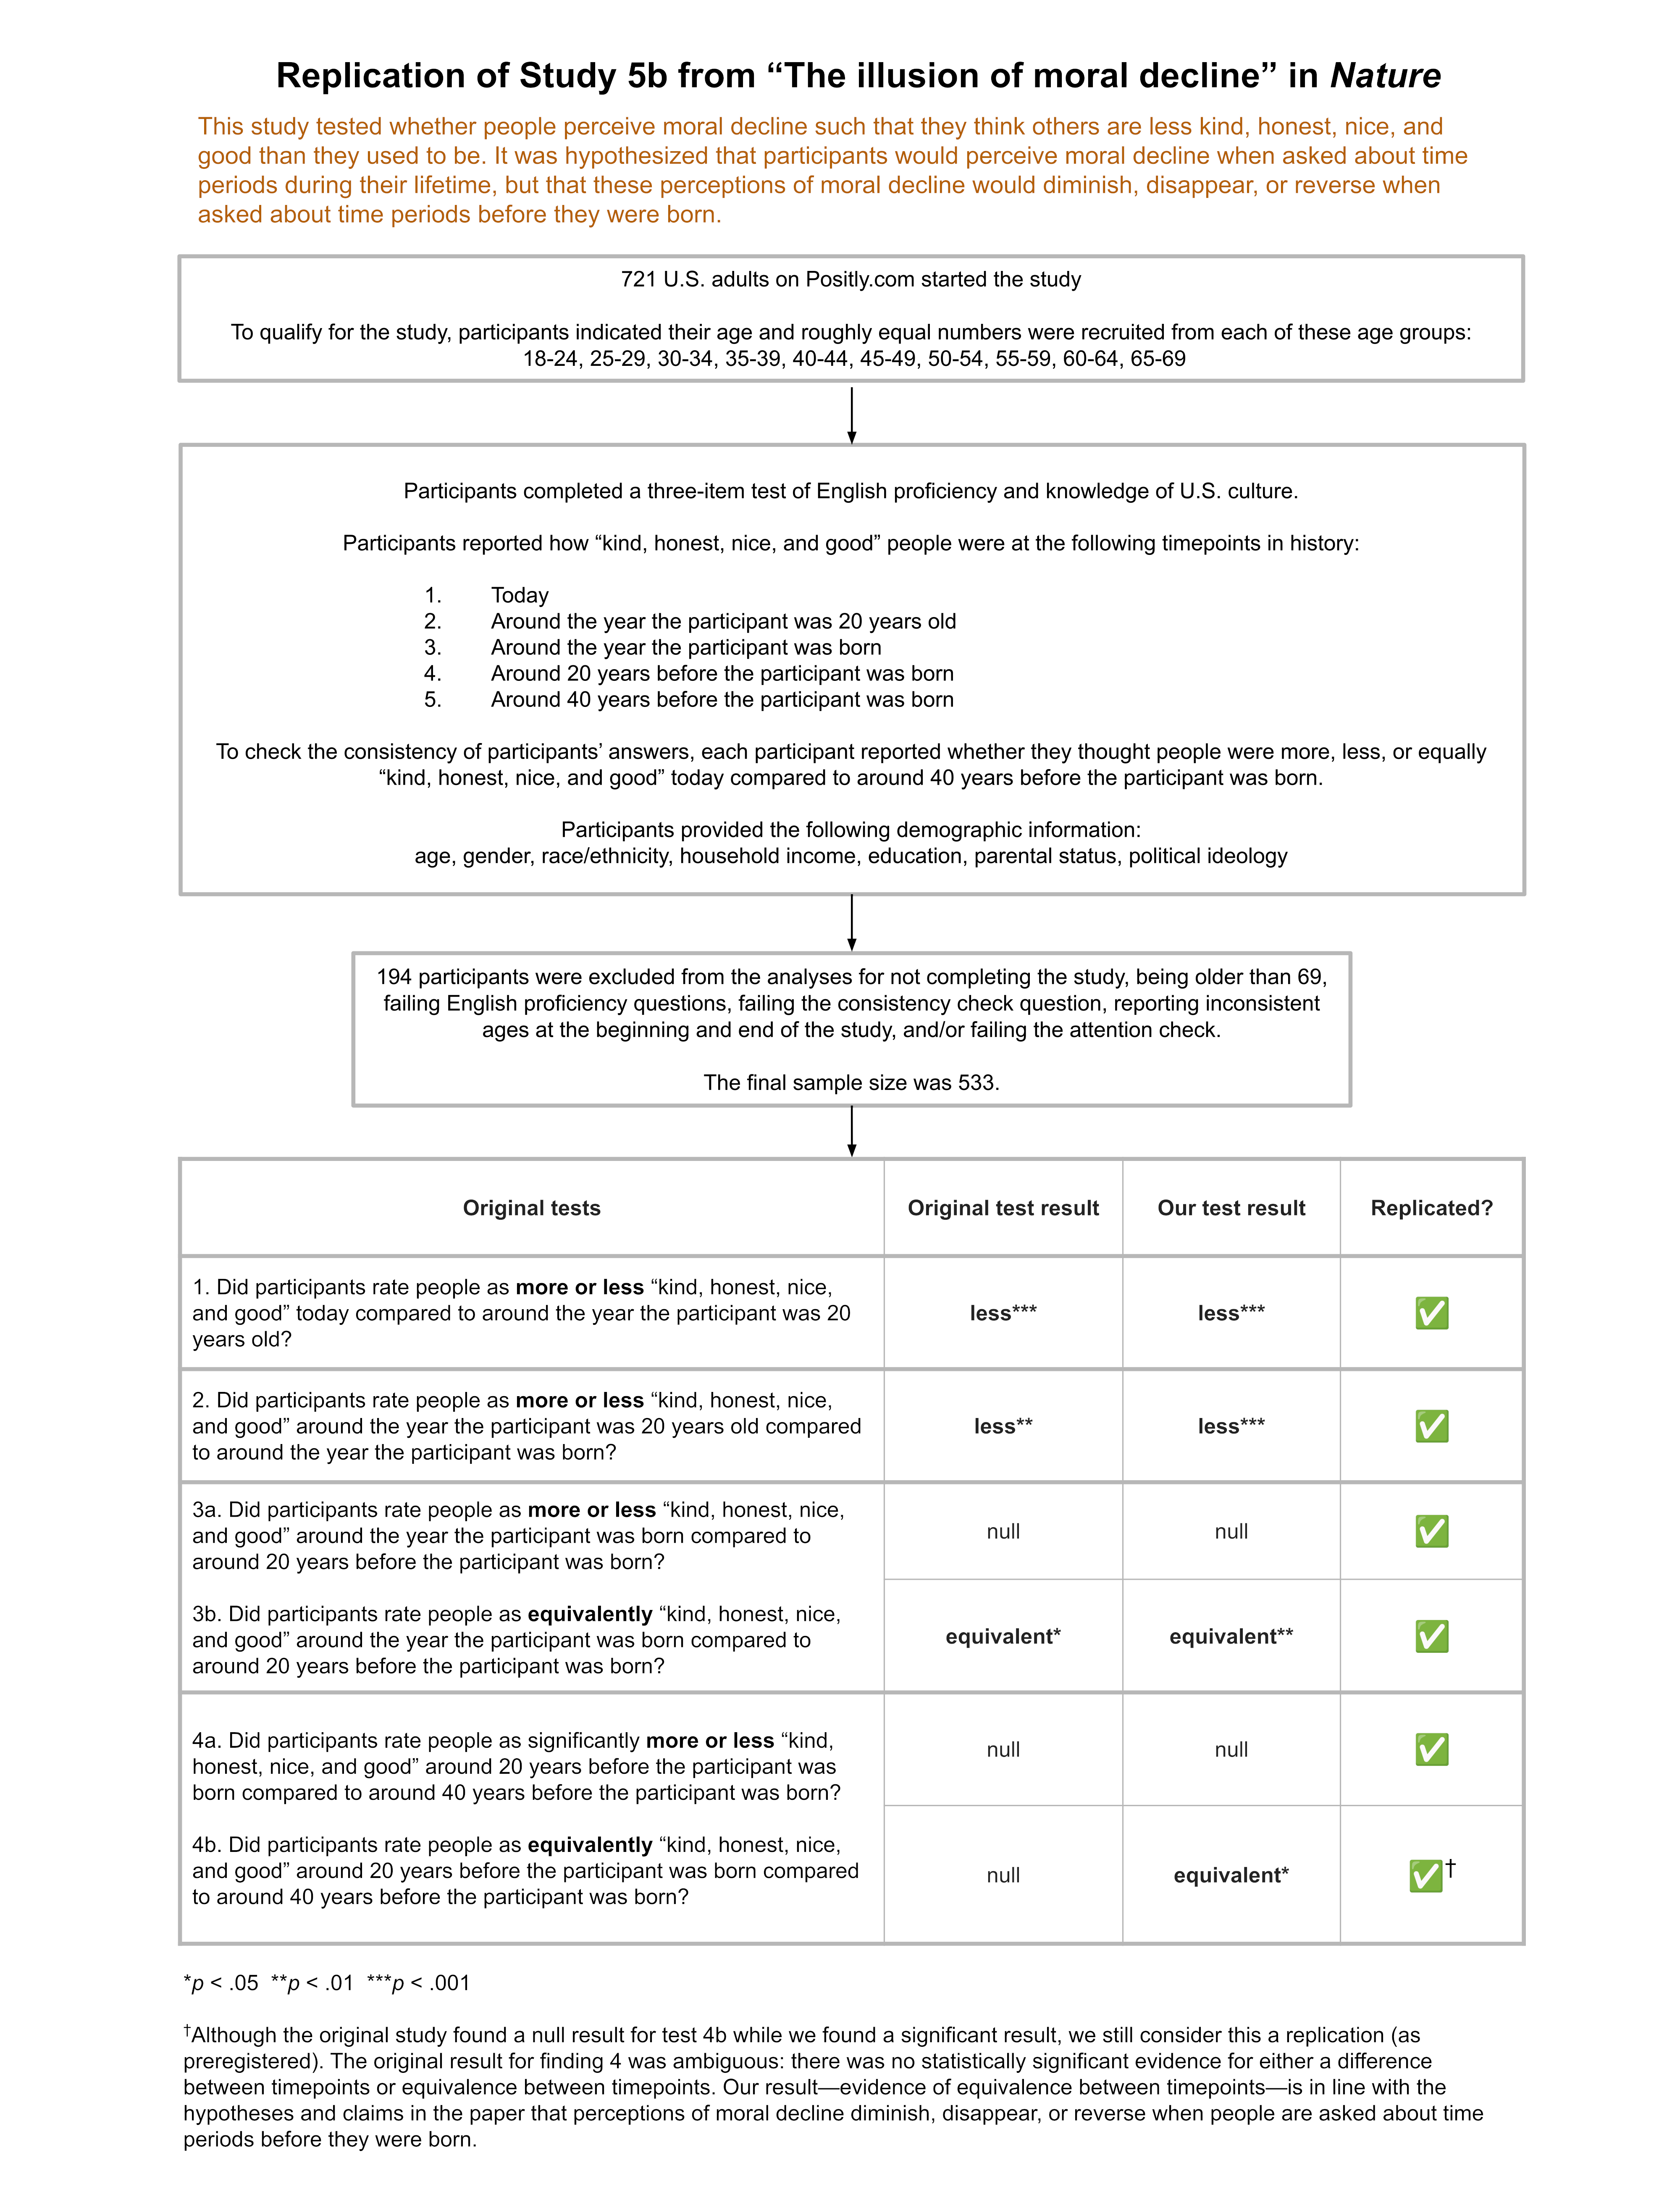
We ran a replication of Study 5b from this paper. This study tested whether people believe that morality is declining over time.
The paper noted that people encounter disproportionately negative information about current-day people (e.g., via the media) and people often have weaker emotional responses to negative events from the past. As such, the authors hypothesized that participants would think people are less moral today than people used to be, but that this perception of moral decline would diminish when comparing timepoints before participants were born.
To test these hypotheses, the study asked each participant to rate how “kind, honest, nice, and good” they thought people are today and were at four previous timepoints corresponding, approximately, to when participants were 20 years old, when they were born, 20 years before they were born, and 40 years before they were born.
The results from the original study confirmed the authors’ predictions: Participants perceived moral decline during their lifetime, but there was no evidence of perceived moral decline for the time periods before participants were born.
Our replication found the same pattern of results.
The study received a transparency rating of 4.25 stars because its materials, data, and code were publicly available, but it was not pre-registered. The paper received a replicability rating of 5 stars because all of its primary findings replicated. The study received a clarity rating of 5 stars because the claims were well-calibrated to the study design and statistical results.
Full Report
Study Diagram
Replication Conducted
We ran a replication of Study 5b from: Mastrioanni, A.M., & Gilbert, D.T. (2023). The illusion of moral decline. Nature, 618, 782–789. https://doi.org/10.1038/s41586-023-06137-x
How to cite this replication report: Transparent Replications by Clearer Thinking. (2024). Report #10: Replication of a study from “The illusion of moral decline” (Nature | Mastroianni & Gilbert 2023) https://replications.clearerthinking.org/replication-2023nature618
(Preprint DOI: https://doi.org/10.31234/osf.io/32xvw)
Key Links
- Our Research Box for this replication report includes the pre-registration, study materials, de-identified data, and analysis files.
Overall Ratings
To what degree was the original study transparent, replicable, and clear?
| Transparency: how transparent was the original study? | All materials, analysis code, and data were publicly available. The study was not pre-registered. |
| Replicability: to what extent were we able to replicate the findings of the original study? | All primary findings from the original study replicated. |
| Clarity: how unlikely is it that the study will be misinterpreted? | This study is explained clearly, the statistics used for the main analyses are straightforward and interpreted correctly, and the claims were well-calibrated to the study design and statistical results. |
Detailed Transparency Ratings
| Overall Transparency Rating: | |
|---|---|
| 1. Methods Transparency: | The materials were publicly available and complete. |
| 2. Analysis Transparency: | The analysis code was publicly available and complete. We successfully reproduced the results in the original paper from the publicly available code and data. |
| 3. Data availability: | The raw data were publicly available and complete. |
| 4. Preregistration: | The study was not pre-registered. |
Summary of Study and Results
Summary of the hypotheses
The original study made two key predictions:
- For time periods during study participants’ lifetimes, participants would perceive moral decline. In other words, they would believe people are morally worse today than people were in the past.
- For time periods before participants were born, participants’ perceptions of moral decline would diminish, disappear, or reverse (relative to the time periods during their lifetimes).
The original paper argues that these results are predicted by the two features that the authors hypothesize produce perceptions of moral decline: (a) a biased exposure effect whereby people see more negative information than positive information about current-day people (e.g., via the media); (b) a biased memory effect whereby people are less likely to have strong negative emotional responses to negative events from the past.
Summary of the methods
The original study (N=387) and our replication (N=533) examined participants’ perceptions of how moral other people were at different points in time.
Participants from the following age groups were recruited to participate in the study:
- 18–24
- 25–29
- 30–34
- 35–39
- 40–44
- 45–49
- 50–54
- 55–59
- 60–64
- 65–69
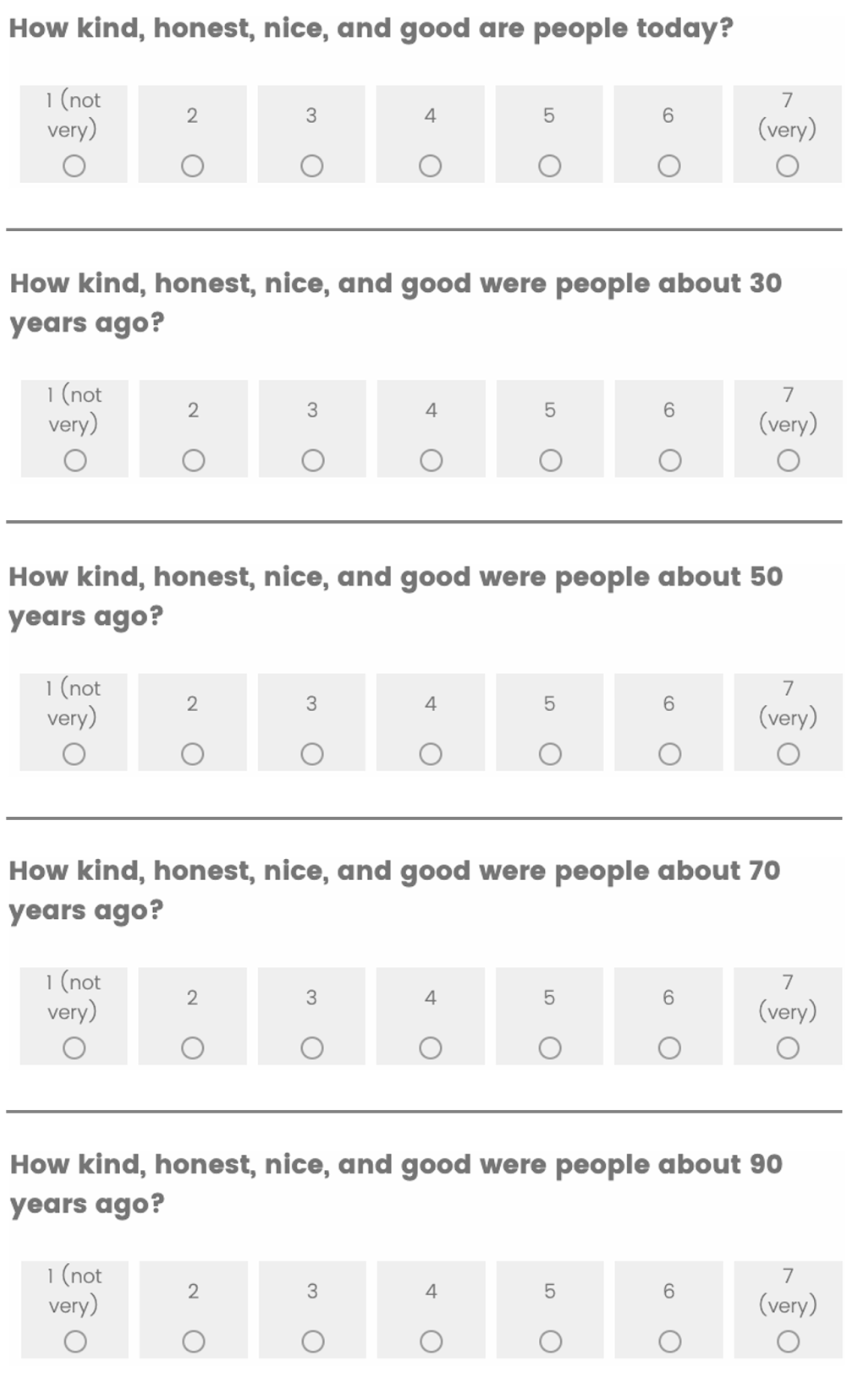
After answering a few pre-study questions (see “Study and Results in Detail” section), participants were told, “In this study, we’ll ask you how kind, honest, nice, and good people were at various points in time. If you’re not sure or you weren’t alive at that time, that’s okay, just give your best guess.”
Participants then completed the five primary questions of interest for this study, reporting how “kind, honest, nice, and good” people were at five different timepoints:
- today (“today”)
- around the year the participant turned 20 (“20 years after birth”)
- around the year the participant was born (“birth year”)
- around 20 years before the participant was born (“20 years before birth”)
- around 40 years before the participant was born (“40 years before birth”)
Going forward, we will use the terms in parentheses as shorthand for each of these timepoints. But please note that the timepoints asked about were approximate—for example, “birth year” is not the exact year each participant was born, but it is within a 5-year range of each participant’s birth year.
Figure 1 shows the versions of the primary questions that a 50-54 year-old participant would receive. Each question was asked on a separate survey page. Participants in other age groups saw the same general questions, but the number of “years ago” in questions 2-5 was adjusted to their age group. Participants aged 18-24 did not receive the second question because today and 20 years after birth were the same period of time for participants in this age group.
After completing the primary questions of interest, participants completed a consistency-check question, attention-check question, and demographic questionnaire (see “Study and Results in Detail” section).
Summary of the primary results
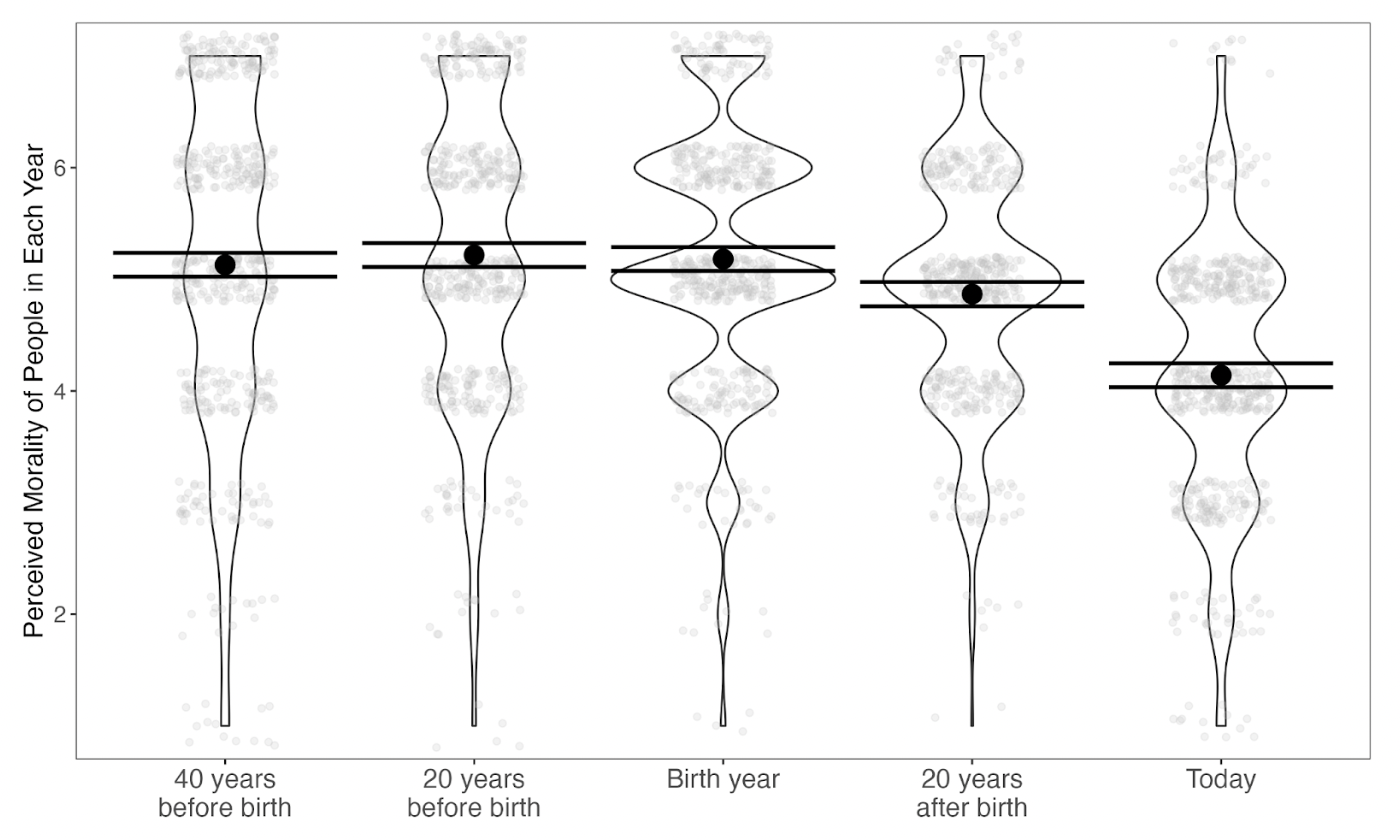
The original paper compared participants’ average ratings of how “kind, honest, nice, and good” people were between each adjacent timepoint. They found that:
- Participants rated people as less kind, honest, nice, and good today vs 20 years after birth.
- Participants rated people as less kind, honest, nice, and good 20 years after birth vs birth year.
- Participants rated people as equivalently kind, honest, nice, and good at birth year vs 20 years before birth.
- There was no statistically significant evidence of either a difference or equivalence between participants’ ratings of how kind, honest, nice, and good people were 20 years before birth vs 40 years before birth. (However, if anything, participants’ ratings were lower at 40 years before birth, which was consistent with the original paper’s hypotheses.)
See “Study and Results in Detail” section for details on the statistical analyses and model results.
When the original authors reviewed our pre-registration prior to replication data being collected, Dr. Mastroianni offered insights about what results they would be more or less surprised by if we found them in our replication data. Because his comments are from prior to the collection of new data, we and the original authors both thought they added useful context to our report:
As for what constitutes a replication, it’s an interesting question. We ran our studies to answer a question rather than to prove a point, so the way I think about this is, “what kinds of results would make me believe the answer to the question is different from the one I believe now?”
- If Contrast 1 was not significant, this would be very surprising, as it would contradict basically every other study in the paper, as well as the hundreds of surveys we review in Study 1.
- If Contrast 2 was not significant, this would be mildly surprising. Contrast 2 is a direct replication of a significant contrast we also saw in Study 2c (as is Contrast 1, for that matter). But this difference was fairly small both times, so it wouldn’t be completely crazy if it didn’t show up sometimes.
- Contrasts 3 and 4 were pretty flat in the original paper. It would be very surprising if those were large effects in the replication. If they’re significant but very small in either direction, it wouldn’t be that surprising.
Basically, it would be very surprising if people perceive moral decline at both points before their birth, but they perceive moral improvement at both points after their birth. That would really make us scratch our heads. It would be surprising in general if there was more decline in Contrasts 3 & 4 than in 1 & 2.
Dr. Adam Mastroianni in email to Transparent Replications team, 2/29/2024.
Summary of replication results
When we analyzed our data, the results of our replication aligned extremely closely with the results of the original study (compare Figure 2 below to Figure 4 in the original paper).
The only minor difference in the statistical results between the original study and our replication was that our replication found statistically significant evidence of equivalence between participants’ ratings of how kind, honest, nice, and good people were at 20 years before birth versus 40 years before birth. As specified in our preregistration, we still consider this a replication of the original results because it is consistent with the paper’s hypothesis (and subsequent claims) that perceptions of moral decline diminish, disappear, or reverse if people rate time periods before they were born.
Here is a summary of the findings in the original study compared to the replication study:
| Morality ratings in original study | Morality ratings in replication study | Replicated? |
|---|---|---|
| today < 20 years after birth | today < 20 years after birth | ✅ |
| 20 years after birth < birth year | 20 years after birth < birth year | ✅ |
| birth year = 20 years before birth | birth year = 20 years before birth | ✅ |
| 20 years before birth ? 40 years before birth | 20 years before birth = 40 years before birth | ✅ |
Study and Results in Detail
Methods in detail
Preliminary survey questions
Before completing the primary questions of interest in the survey, participants indicated which of the following age groups they belonged to:
- 18–24
- 25–29
- 30–34
- 35–39
- 40–44
- 45–49
- 50–54
- 55–59
- 60–64
- 65–69
- 70+
Participants who selected 70+ were screened out from completing the full survey. The original study recruited nearly equal numbers of participants for each of the other 10 age groups. Our replication attempted to do the same, but did not perfectly recruit equal numbers from each age group (see Appendix for more information).
Participants also completed three questions that, according to the original paper, were designed to test “English proficiency and knowledge of US American culture”:
Which of the following are not a type of footwear?
- Sneakers
- Slippers
- Flip-flops
- High heels
- Bell bottoms
Which of the following would be most likely to require an RSVP?
- A wedding invitation
- A restaurant bill
- A diploma
- A thank-you note
- A diary
Which of the following would be most likely to have a sign that says “out of order”?
- An elevator
- A person
- A pizza
- A book
- An umbrella
Consistency check
After completing the five primary questions of interest described in the “Summary of Study and Results” section above, participants answered the following consistency check question:
Please choose the option below that best represents your opinion:
- People are MORE kind, honest, nice, and good today compared to about [X] years ago
- People are LESS kind, honest, nice, and good today compared to about [X] years ago
- People are equally kind, honest, nice, and good today compared to about [X] years ago
“[X]” took on the same value as the final timepoint—around 40 years before the participant was born. This question was designed to ensure that participants were providing consistent ratings in the survey.
Demographics and attention check
After completing the consistency check question, participants reported their age, gender, race/ethnicity, household income, educational attainment, parental status, and political ideology.
Embedded among these demographic questions was the following attention-check question:
Some people are extroverted, and some people are introverted. Please select the option “other” and type in the word “apple”.
- Extroverted
- Introverted
- Neither extroverted nor introverted
- Other _______
Exclusion criteria
Participants’ responses were excluded from the data if any of the following applied:
- They did not complete the study
- They reported being in the 70+ age group
- They failed any of the three English proficiency questions
- They failed the attention check question
- Their answer to the consistency check question was inconsistent with their ratings for today and 40 years before birth
- Their reported age in the demographics section was inconsistent with the age group they selected at the beginning of the study
Of the 721 participants who took the survey, 533 passed all exclusion criteria and were thus included in our analyses.
Primary analyses: detailed results
As pre-registered, we ran the same statistical analyses as the original paper.
To analyze the primary questions of interest, we ran a linear mixed effects model, with random intercepts for participants, testing whether participants’ morality ratings differed by timepoint (using the lmer package in R).
We then tested four specific contrasts between the five timepoints using a Holm-Bonferroni correction for multiple comparisons (using the emmeans package in R):
- today vs 20 years after birth
- 20 years after birth vs birth year
- birth year vs 20 years before birth
- 20 years before birth vs 40 years before birth
Here are the results of these contrasts:
| Contrast | Estimate | SE | df | t-value | p-value |
|---|---|---|---|---|---|
| today vs 20 years after birth | -0.727 | 0.052 | 2094 | -13.915 | <0.001*** |
| 20 years after birth vs birth year | -0.314 | 0.052 | 2094 | -6.015 | <0.001*** |
| birth year vs 20 years before birth | -0.036 | 0.051 | 2088 | -0.699 | 0.485 |
| 20 years before birth vs 40 years before birth | 0.088 | 0.051 | 2088 | 1.729 | 0.168 |
There were statistically significant differences between today and 20 years after birth and between 20 years after birth and birth year, but not between birth year and 20 years before birth or between 20 years before birth and 40 years before birth—the same pattern as the original study results.
Next, we conducted equivalence tests (using the parameters package in R), for the two comparisons that were not statistically significant. Here are the results:
| Contrast | ROPE | 90% Confidence Interval | SGPV | Equivalence | p-value |
|---|---|---|---|---|---|
| birth year vs 20 years before birth | [-0.13 0.13] | [-0.09, 0.02] | > .999 | Accepted | 0.003** |
| 20 years before birth vs 40 years before birth | [-0.14, 0.14] | [0.04, 0.14] | > .999 | Accepted | 0.034* |
SGPV = second generation p-value (the proportion of the confidence interval range that is inside the ROPE)
Bold numbers are statistically significant at the level indicated by the number of asterisks: *p < 0.05, **p < 0.01, ***p < 0.001.
These tests found that, for both contrasts, 100% of the confidence interval range was inside the region of practical equivalence (ROPE). (See the Appendix for a brief discussion on how the ROPE was determined.) Thus, there was statistically significant evidence that birth year and 20 years before birth were equivalent and that 20 years before birth and 40 years before birth were equivalent. (You can read about how to interpret equivalence test results from the parameters package here.)
In the original study, birth year and 20 years before birth were found to be equivalent, but there was not statistically significant evidence for equivalence between 20 years before birth and 40 years before birth. As mentioned earlier, we consider equivalence between 20 years before birth and 40 years before birth to be a successful replication of the original study’s findings because it is in line with the claims in the paper that perceptions of moral decline diminish, disappear, or reverse when people are asked about time periods before they were born.
Secondary analyses
As in the original paper, we also tested for relationships between participants’ morality ratings and various demographic variables. Since this analysis was not central to the paper’s claims, we preregistered that these results would not count towards the replicability rating for this paper.
Following the analytical approach in the original paper, we ran a linear regression predicting the difference in participants’ morality ratings between today and birth year by all of the following demographic variables:
- Age
- Political ideology
- Parental status
- Gender
- Race/ethnicity
- Educational attainment
Here are the statistical results from this analysis:
| Variable | Original Results (R2 = 0.129) | Replication Results (R2 = 0.128) |
|---|---|---|
| Age | -0.014** (0.005) | -0.003 (0.005) |
| Political ideology | -0.335*** (0.058) | -0.307*** (0.048) |
| Parental status | 0.131 (0.150) | 0.345** (0.123) |
| Gender | ||
| – Male vs Female | 0.137 (0.139) | 0.046 (0.117) |
| – Other vs Female | 0.750 (0.764) | 1.610* (0.761) |
| Race | ||
| – American Indian or Alaska Native vs White | n/a | 1.635 (0.928) |
| – Asian vs White | 0.061 (0.212) | -0.044 (0.208) |
| – Black or African-American vs White | -0.289 (0.327) | -0.500 (0.271) |
| – Hawaiian or Pacific Islander vs White | -2.039 (1.305) | n/a |
| – Hispanic or Latino Origin vs White | 0.006 (0.367) | 0.036 (0.265) |
| – More than 1 of the above vs White | 0.546 (0.496) | 0.219 (0.344) |
| – Other vs White | 0.535 (1.301) | 0.355 (0.926) |
| Education | -0.012 (0.045) | 0.063 (0.037) |
Note: in the analysis code for the original study, R defaulted to using Asian as the comparison group for race (i.e., each other race category was compared against Asian). We thought the results would be more informative if the comparison group was White (the majority group in the U.S.), so the values in the Original Results column display the results when we re-run the model in the original analysis code with White as the comparison group.
We explain the results for each demographic variable below:
Age
The original study found a statistically significant effect of age such that older people perceived more moral decline (i.e., a larger negative difference between today and birth year morality ratings). However, the original paper argued that this was because the number of years between today and birth year was larger for older participants.
Our replication did not find a statistically significant effect of age.
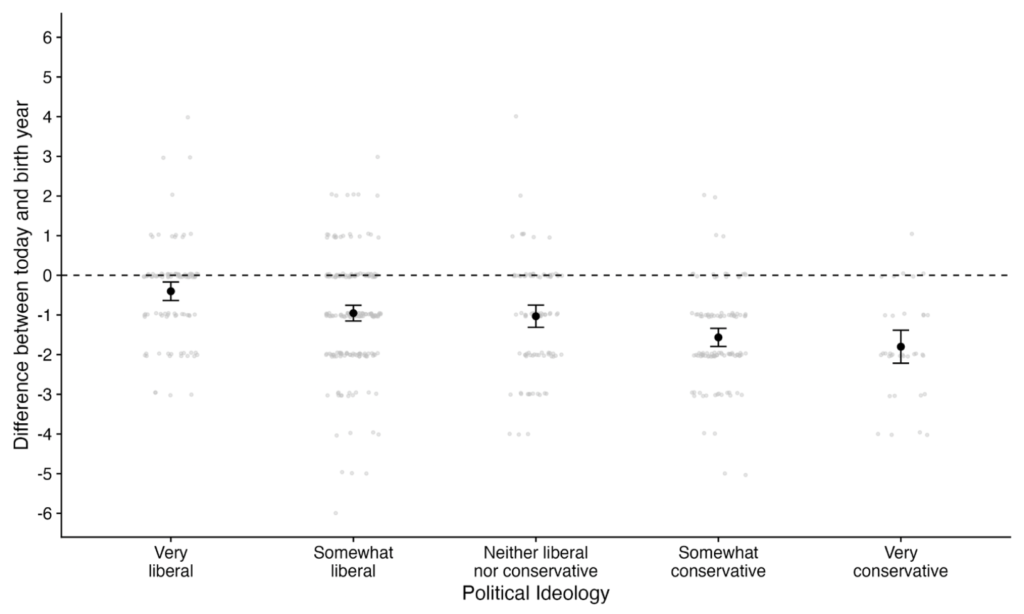
Political ideology
Participants could choose any of the following options for political ideology:
- Very liberal
- Somewhat liberal
- Neither liberal nor conservative
- Somewhat conservative
- Very conservative
We converted this to a numeric variable ranging from -2 (very liberal) to 2 (very conservative).
The original study found a statistically significant effect of political ideology such that more conservative participants perceived more moral decline. Our replication found the same result.
Following the original study, we ran a one-sample t-test to determine whether participants who identified as “very liberal” or “somewhat liberal” still perceived moral decline, on average. These participants had an average score of less than zero (mean difference = -0.76, t(295) = -9.6252, p < 2.2e-16), meaning that they did, on average, perceive moral decline.
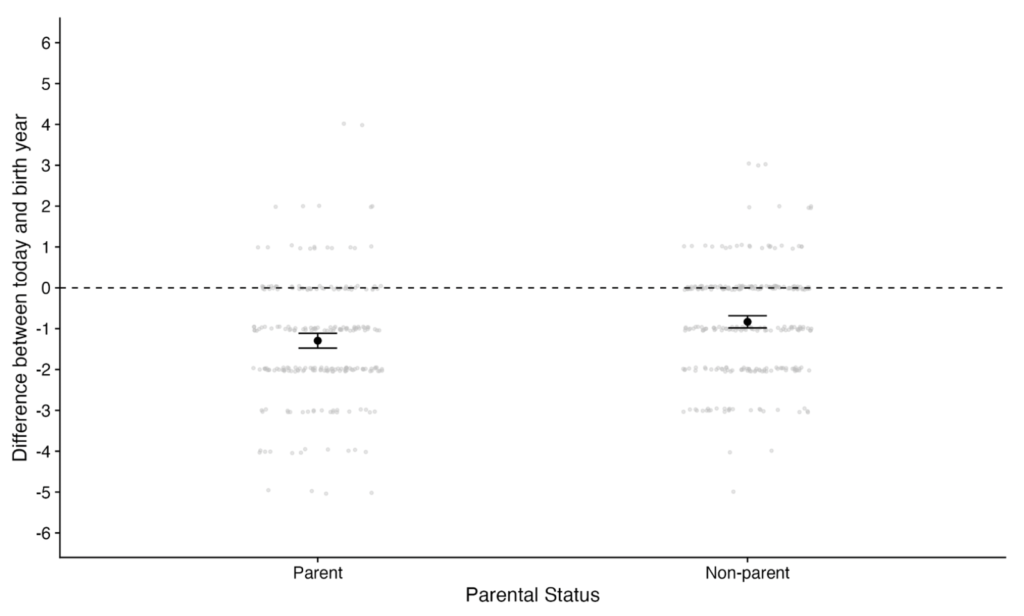
Parental status
Participants reported how many children they had. We converted this into a binary variable representing whether or not each participant is a parent.
The original study did not find a statistically significant effect of parental status. However, our replication found a significant effect such that parents perceived more moral decline than non-parents.
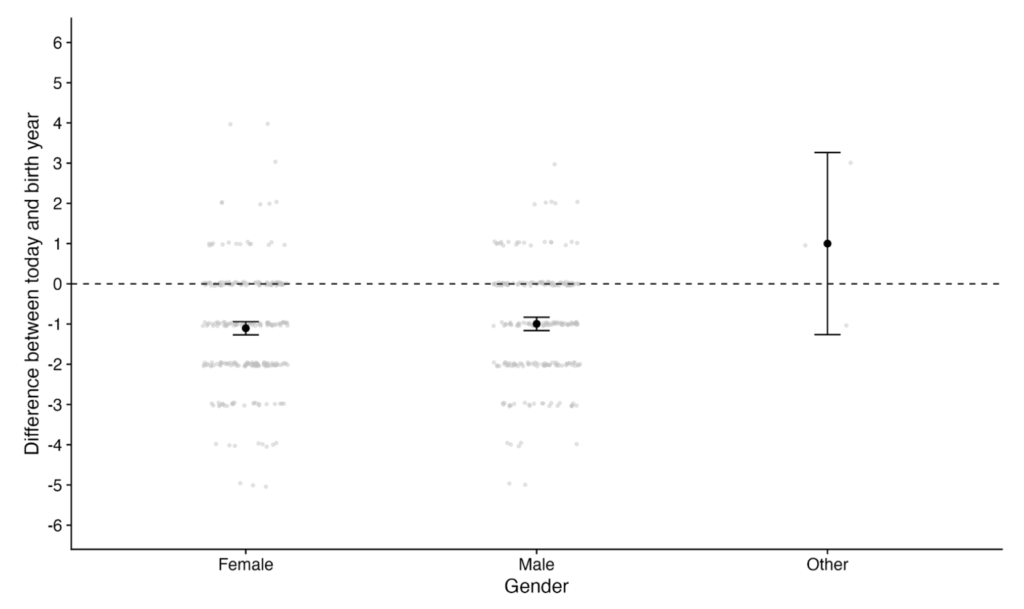
Gender
Participants could choose any of the following options for gender:
- Male
- Female
- Other
The original study did not find a statistically significant effect of gender. Our replication, on the other hand, found a significant effect of gender such that participants who selected “Other” did not perceive moral decline, on average. However, we do not recommend giving much credence to this statistical difference because only 3 out of the 533 participants selected “Other.” We think conclusions should not be drawn in either direction with such a small sample size for that category.
Race/ethnicity
Participants could choose any of the following options for race/ethnicity:
- American Indian or Alaska Native
- Asian
- Black or African-American
- Hispanic or Latino Origin
- Hawaiian or Pacific Islander
- White
- Other
- More than 1 of the above
Neither the original study nor our replication found a statistically significant effect of race/ethnicity when the variable is dummy coded with White as the comparison group.
Education
Participants could choose any of the following options for education:
- Did not complete high school
- High school diploma
- Some college
- Associate’s degree
- Four-year college degree
- Some graduate school
- Graduate school
We converted this to a numeric variable ranging from 0 (did not complete high school) to 6 (graduate school).
Neither the original study nor our replication found a statistically significant effect of education.
Interpreting the Results
All of the primary original-study results replicated in the data we collected, according to the replication criteria we pre-registered.
It is worth highlighting that there was one minor statistical discrepancy between the primary results for the two datasets. The original study did not find statistical evidence for either a difference or equivalence between 20 years before birth and 40 years before birth. Our replication also found no statistical evidence for a difference between these timepoints, but it did find evidence for equivalence between the timepoints. We specified in advance that this pattern of results would qualify as a successful replication because it supports the original paper’s hypothesis that perceptions of moral decline diminish, disappear, or reverse when people are asked about time periods before they were born.
Among the secondary analyses, which tested the relationship between perceptions of moral decline and various demographic factors, our replication results differed from the original study results for a few variables. The original study found that only political ideology and age were statistically significant predictors of participants’ perceptions of moral decline. Our replication found similar results for political ideology, but it did not find age to be a significant predictor. Additionally, our replication found parental status and gender to be significant predictors. However, we strongly caution against interpreting the gender result strongly. This result was driven by the fact that the gender response option “Other” had a substantially different average moral decline rating from the response options “Male” and “Female,” but only 3 out of 533 participants comprised the “Other” category (see Figure 5). We consider this too small of a subgroup sample size to draw meaningful conclusions from. As we pre-registered, the secondary analyses were not considered in our replication ratings because they were not central to the paper’s hypotheses and the authors did not strongly interpret or theorize about the demographic-level findings.
Finally, the paper was careful to note that its findings are not direct evidence for the biased exposure and biased memory effects that it postulates as causes of the perception of moral decline:
“The illusion of moral decline is a robust phenomenon that surely has several causes, and no one can say which of them produced the illusion that our studies have documented. Studies 5a and 5b do not directly implicate the BEAM mechanism in that production but they do make it a viable candidate for future research.” (p. 787)
We would like to reiterate this interpretation: the observed result is what one would expect if the biased exposure effect and biased memory effect gave rise to perceptions of moral decline, but this study does not provide causal evidence for either of these mechanisms.
Conclusion
Overall, we successfully replicated all of the primary findings from the original study. Collectively, these findings suggest that people in the U.S. (aged 18-69), on average, perceive moral decline for time periods during their lifetimes, but not for time periods before they were born. The study received 5 stars for replicability.
All of the study’s data, materials, and analysis code were publicly available and well-documented, which made this replication straightforward to conduct. We also successfully reproduced the results in the original paper using the provided data and analysis code. The one area for improvement on the transparency front is preregistration: this study was not pre-registered, even though it was very similar to a previous study in this paper (Study 2c). The study received 4.25 stars for transparency.
Generally, the study’s analyses were appropriate and its claims were well-calibrated to its study design and results. The study received 5 stars for clarity.
Acknowledgements
We want to thank the authors of the original paper for making their data, analysis code, and materials publicly available, and for their quick and helpful correspondence throughout the replication process. Any errors or issues that may remain in this replication effort are the responsibility of the Transparent Replications team.
We also owe a big thank you to our 533 research participants who made this study possible.
Finally, I am extremely grateful to Amanda Metskas and the rest of the Transparent Replications team for their advice and guidance throughout the project.
Author Response
The authors of the original study shared the following response to this report:
“We are pleased to see these effects replicate, and we are grateful to the Transparent Replications team for their work.”
Dr. Adam Mastroianni via email 7/5/2024
Purpose of Transparent Replications by Clearer Thinking
Transparent Replications conducts replications and evaluates the transparency of randomly-selected, recently-published psychology papers in prestigious journals, with the overall aim of rewarding best practices and shifting incentives in social science toward more replicable research.
We welcome reader feedback on this report, and input on this project overall.
Appendices
Additional Information about the Methods
Recruitment
Both the original study and our replication recruited a sample of participants stratified by age. However, the original study and our replication used slightly different methods for doing so, which resulted in small differences in age-group proportions between the two studies.
In the original study, participants were first asked to report their age. A quota system was set up inside the survey software such that, in theory, only 50 participants from each of the following age group should be allowed to participate: 18–24, 25–29, 30–34, 35–39, 40–44, 45–49, 50–54, 55–59, 60–64, 65–69. If participants indicated that they were 70 or older or if they were not among the first 50 participants from a given age group to take the study, they were not allowed to participate in the study (the original study did not have a perfect split by age, but it was quite close to 50 per group; see the table below). After completing the age question, participants completed the three English proficiency and knowledge of US American culture questions. If they failed any of the proficiency questions, they were not allowed to participate in the study.
In order to ensure that all participants were paid for the time they spent on the study, we did not use the same pre-screening process used in the original study. In the original study, if the age quota for a participant’s age group was already reached, or if a participant didn’t pass the screening questions, they were not paid for the initial screening questions they completed. In order to avoid asking participants to answer questions for which they wouldn’t be paid, we used age quotas within Positly to recruit participants in approximately equal proportions for each age group. Participants still indicated their age in the first part of the survey, but they were no longer screened out by a built-in age quota. This process did not achieve perfectly equal recruitment numbers by age group. We expect that this is because some participants reported an age in our experiment that differed from their listed age in the recruitment platform’s records. This could be for a variety of reasons including that some members of a household might share an account.
Although our recruitment strategy did not achieve perfect stratification by age group, the two studies had relatively similar age-group breakdowns. The table below shows the pre-exclusion and post-exclusion stratification by age group for both studies.
We also want to note a minor deviation from our pre-registered recruitment strategy. In our pre-registration we said:
“We will have 600 participants complete the study. If we do not have 520 or more participants remaining after we apply the exclusion criteria, then we will collect additional participants in batches of 20 until we reach 520 post-exclusion participants. We will not conduct any analyses until data collection is complete. When collecting data, we will apply age-group quotas by collecting 60 participants from each of the following ten age groups: 18–24, 25–29, 30–34, 35–39, 40–44, 45–49, 50–54, 55–59, 60–64, 65–69. If we need to recruit additional participants, we will apply the age-group quotas in such a way as to seek balance between the age groups.”
Because recruiting participants from the youngest age group (18-24) and the oldest age group (65-69) turned out to be extremely slow, we decided not to “apply the age-group quotas in such a way as to seek balance between the age groups” when we recruited participants beyond the original 600. (Note: We did not look at the dependent variables in the data until we had fully finished data collection, so this small deviation from the preregistration was not influenced by the data itself.)
It’s also worth noting that the total number of participants we recruited was not a multiple of 20 despite our stated recruitment approach. This was because each time one collects data from an online crowdsourcing platform like Positly it’s possible that a few additional participants will complete the study than the original recruitment target. For example, sometimes participants complete the study in the survey software but do not indicate to the crowdsourcing platform that they completed the study. Because we had many rounds of recruitment for this study, each round had the opportunity to collect slightly more participants than the targeted number.
| Age group | Before exclusions | After exclusions | ||
| Original study (n=499) | Replication study (n=721) | Original study (n=387) | Replication study (n=533) | |
| 18-24 | 10.0% | 7.9% | 9.8% | 7.5% |
| 25–29 | 10.4% | 11.2% | 8.8% | 10.7% |
| 30–34 | 10.4% | 12.1% | 10.3% | 12.0% |
| 35–39 | 10.8% | 12.6% | 11.6% | 13.3% |
| 40–44 | 10.2% | 9.8% | 11.4% | 10.1% |
| 45–49 | 10.0% | 9.7% | 10.1% | 9.6% |
| 50–54 | 10.0% | 9.4% | 10.1% | 10.5% |
| 55–59 | 10.0% | 9.7% | 10.9% | 9.4% |
| 60–64 | 8.2% | 8.8% | 8.5% | 9.4% |
| 65–69 | 9.8% | 7.8% | 8.5% | 7.5% |
| 70+ | 0% | 0.8% | 0% | 0% |
We also want to note one change we made in how subjects were recruited during our data collection. In the early portion of our data collection the recruited subjects first completed a pre-screener that asked the three English proficiency and knowledge of US American culture questions and confirmed that they were within the eligible age range for the study. All participants were paid for the pre-screener, and those who passed it were invited to continue on to take the main study. 146 participants passed the pre-screener and went on to take the main study.
We found that the pre-screening process was slowing down recruitment, so we incorporated the screening questions into the main study and allowed recruited participants to complete and be paid for the study even if they failed the screening. We excluded participants who failed the screening from our data analysis. 575 participants took the study after this modification was made.
Finally, it’s important to note that our pre-exclusion sample size of n=721 is the number of participants who provided consent to participate in our study; the number of participants in our replication who passed the screening criteria of being between ages 18-69 and correctly answering the three English proficiency and knowledge of US American culture questions was n=703.
Additional Information about the Results
Corrections for multiple comparisons
For the primary analysis in which participants’ morality ratings are compared between timepoints, we followed the analytical approach used in the original paper and used a Holm-Bonferroni correction for multiple comparisons for the four contrasts that were tested. However, we think it is unnecessary to correct for multiple comparisons in this situation. As argued by Rubin (2024), multiple comparisons would only be necessary in this context if the authors would have considered their hypothesis confirmed if at least one of the contrasts returned the hypothesized result. Rather, the authors needed each of the four contrasts to match their expected pattern in order to confirm their hypothesis. As such, we argue that correcting for multiple comparisons is overly conservative in this study. However, not correcting for multiple comparisons on our replication data does not change the statistical significance of any of the findings.
Region of practical equivalence (ROPE) for equivalence tests
It’s important to note that when conducting equivalence tests, evidence for equivalence depends on what one sets as the region of practical equivalence (ROPE). The original authors chose to use the default calculation of ROPE in the parameters package in R (see here for more information). Given that the original study was not pre-registered, we think this is a reasonable decision; after knowing the study results, it could be difficult to justify a particular ROPE without being biased by how this would affect the findings. To make our results comparable to the original study, we also used the default calculation of ROPE. However, we want to note that this is not a theoretical justification for the specific ROPE used in this study; other researchers might reasonably argue for a wider or narrower ROPE.
References
Faul, F., Erdfelder, E., Buchner, A., & Lang, A.-G. (2009). Statistical power analyses using G*Power 3.1: Tests for correlation and regression analyses. Behavior Research Methods, 41, 1149-1160. Download PDF
Mastrioanni, A. M., & Gilbert, D. T. (2023). The illusion of moral decline. Nature, 618, 782–789. https://doi.org/10.1038/s41586-023-06137-x
Rubin, M. (2024). Inconsistent multiple testing corrections: The fallacy of using family-based error rates to make inferences about individual hypotheses. Methods in Psychology, 10, 100140. https://doi.org/10.1016/j.metip.2024.100140
