Executive Summary
| Transparency | Replicability | Clarity |
|---|---|---|
| N/A |
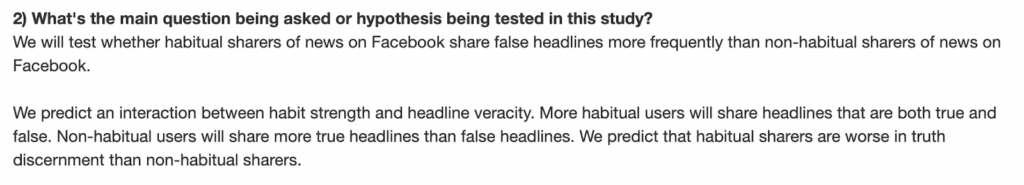
Study 2 from this paper tested whether prompting people to rate the accuracy of news headlines would affect how likely people were to share false headlines versus true headlines—especially among people who habitually share news on Facebook.
While trying to reproduce the results from the study using the original paper’s data and analysis code, we found many different issues. These issues included claims that did not match the provided evidence, statistical results that could be unreliable, group comparisons based on values beyond a scale’s possible range, inflated effect sizes due to a statistical artifact, and numbers we could not reproduce with the original data and code. Given these issues, we decided not to replicate the study. To be clear, the findings of Study 2 could be true, but we consider the evidence presented inadequate for supporting the claims made in the paper.
Generally, when the Transparent Replications team conducts replications, we focus on only one study within a paper (you can learn more about our process here). This can be thought of as similar to a spot-checking approach. If the work in a scientific paper is reliable, it shouldn’t matter which study we choose. That said, it’s of course possible that, by chance, we choose a study that is far less reliable than the other studies in the paper. In this case, we briefly reviewed the other three studies in the original paper to see if they had the same issues as Study 2. Each of the other studies contained some, but not all, of the same issues as Study 2. These are described at the end of the report. Only study 2 was reviewed thoroughly, and it is the study on which the ratings are based.
This study received a transparency rating of 3.75 stars because the materials, data, and code were publicly available and the study was preregistered, but the preregistration was not followed and these deviations were not acknowledged in the paper. The paper did not receive a replicability rating because we did not attempt to replicate it. The paper received a clarity rating of 0 stars because the quantity and severity of the issues we encountered would almost certainly cause readers to misinterpret the results of the study.
Finally, it is important to highlight that the authors of the original paper disagree about the severity of many of the issues we describe. You can see their full response here, and we have included each point they make at the end of every corresponding section in our report.
Full Report
Study Diagram
Evaluation Conducted
We evaluated study 2 from: Ceylan, G., Anderson, I.A., & Wood, W. (2023). Sharing of misinformation is habitual, not just lazy or biased. Proceedings of the National Academy of Sciences, 120(4). https://doi.org/10.1073/pnas.2216614120
How to cite this report: Transparent Replications, Handley-Miner, I. & Metskas, A. (2025). Evaluation of a study from “Sharing of misinformation is habitual, not just lazy or biased” (PNAS | Ceylan, Anderson, & Wood 2023). Clearer Thinking. https://replications.clearerthinking.org/replication-2023pnas120-30
(Report DOI: https://doi.org/10.5281/zenodo.17705056)
Key Links
- Our OSF repository includes the supplemental materials for this report.
- You can read the original paper here.
- You can review the supporting materials for the original paper including the preregistration, data, analysis code, and experimental stimuli.
Overall Ratings
To what degree was the original study transparent, replicable, and clear?
| Transparency: how transparent was the original study? | The study materials, analysis code, and data were publicly available. The study was preregistered, but the preregistered analyses were not followed. Deviations from the preregistration were not acknowledged (the paper states, “We preregistered all hypotheses, primary analyses, and sample sizes.”) |
| Replicability: to what extent were we able to replicate the findings of the original study? | N/A |
| Clarity: how unlikely is it that the study will be misinterpreted? | We uncovered many significant issues with how the study was conducted, analyzed, and reported. These issues include claims that don’t match the provided evidence, statistical results that could be unreliable, group comparisons based on values beyond a scale’s possible range, inflated effect sizes due to a statistical artifact, and numbers we cannot reproduce with the original data and code. We think that these issues, collectively, will almost certainly cause readers to misinterpret the results of the study. |
Detailed Transparency Ratings
| Overall Transparency Rating: | |
|---|---|
| 1. Methods Transparency: | The materials were publicly available and were complete |
| 2. Analysis Transparency: | The analysis code was publicly available and complete, but could not successfully run on the provided data |
| 3. Data availability: | The data were publicly available and almost complete, and authors gave remaining data on request |
| 4. Preregistration: | The study was preregistered, but the preregistration was not followed, and the fact that the preregistration was not followed was not acknowledged |
Summary of Study and Results
Summary of methods and results
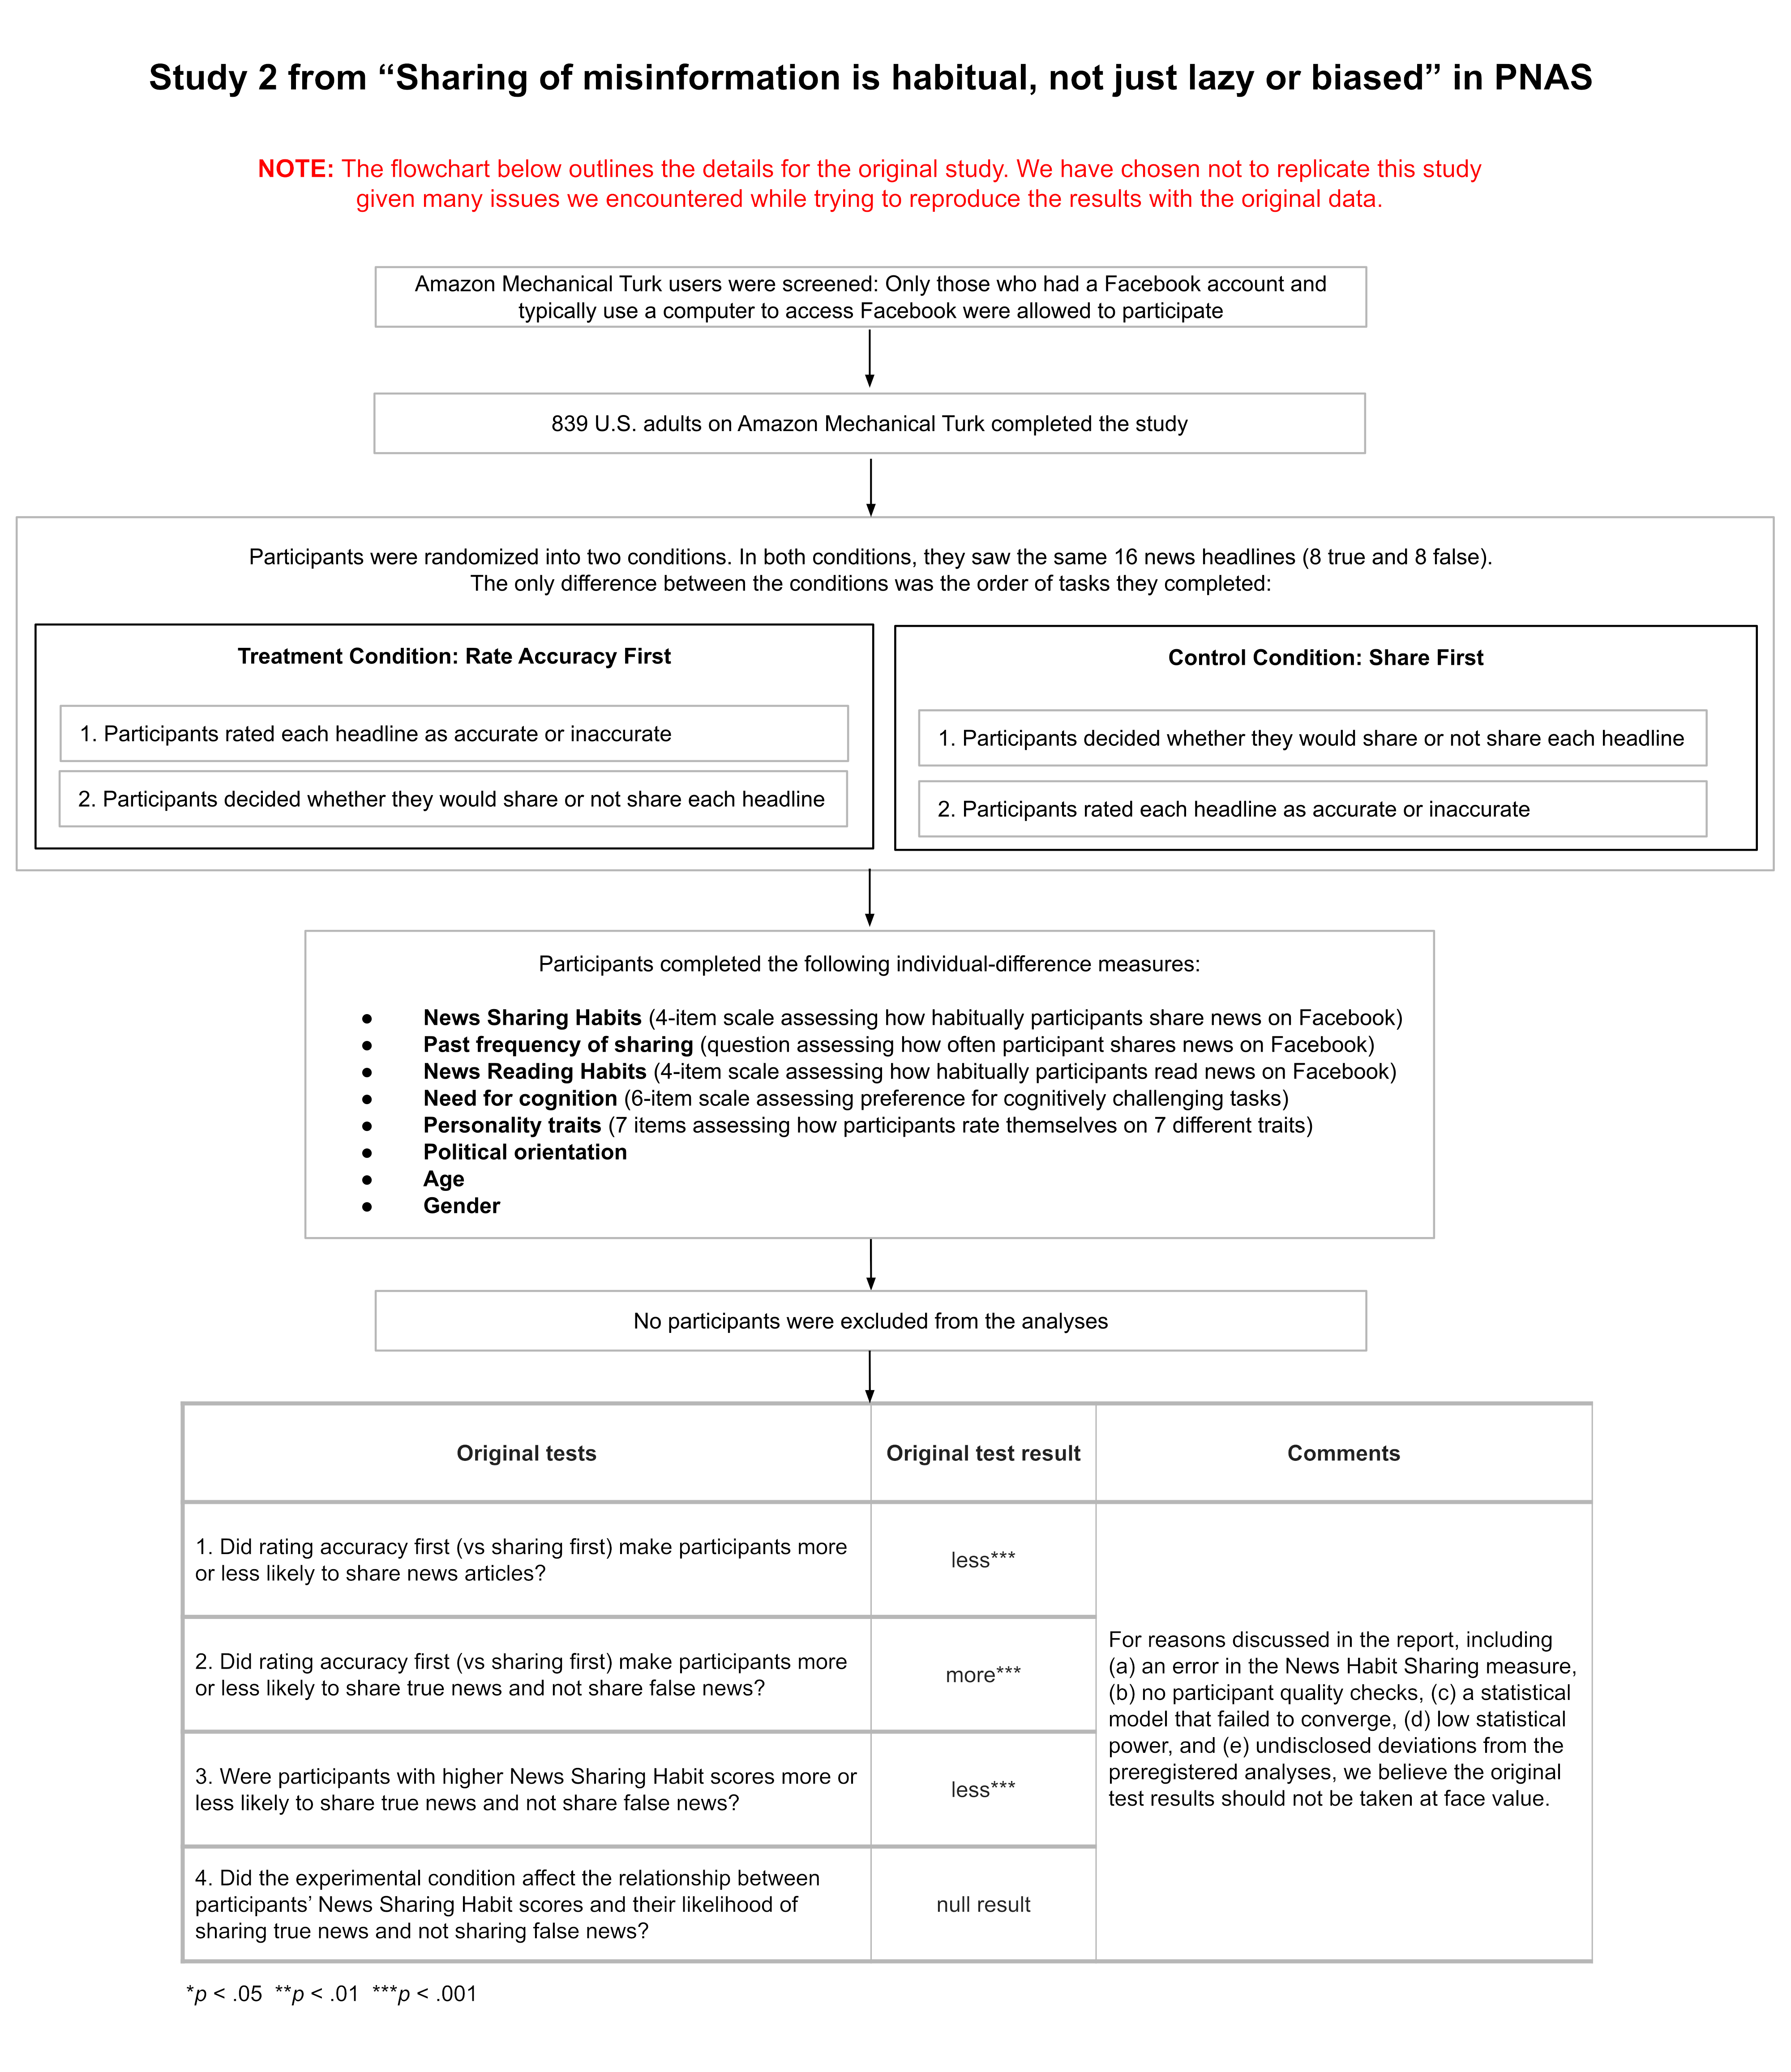
In Study 2, 839 participants recruited from Amazon Mechanical Turk saw 16 news headlines (8 false headlines and 8 true headlines). Participants were asked to imagine that they were seeing these news headlines while scrolling their Facebook newsfeed.
Participants completed two tasks for each headline:
- The Share Task asked participants, “If you were to see the article on Facebook, would you share it?”
- The Accuracy Task asked participants, “To the best of your knowledge, is the claim in the above headline accurate?”
Half of the participants completed the share task first for all of the headlines (control condition) and the other half of participants completed the accuracy task first for all of the headlines (treatment condition).
Study 2 had two stated outcomes of interest: spread of misinformation and discernment. Spread of misinformation was operationalized as the number of false headlines that participants chose to share. Discernment was operationalized as the relationship between whether a news headline was shared and whether it was true. Participants who shared more true headlines and fewer false headlines were considered more discerning.
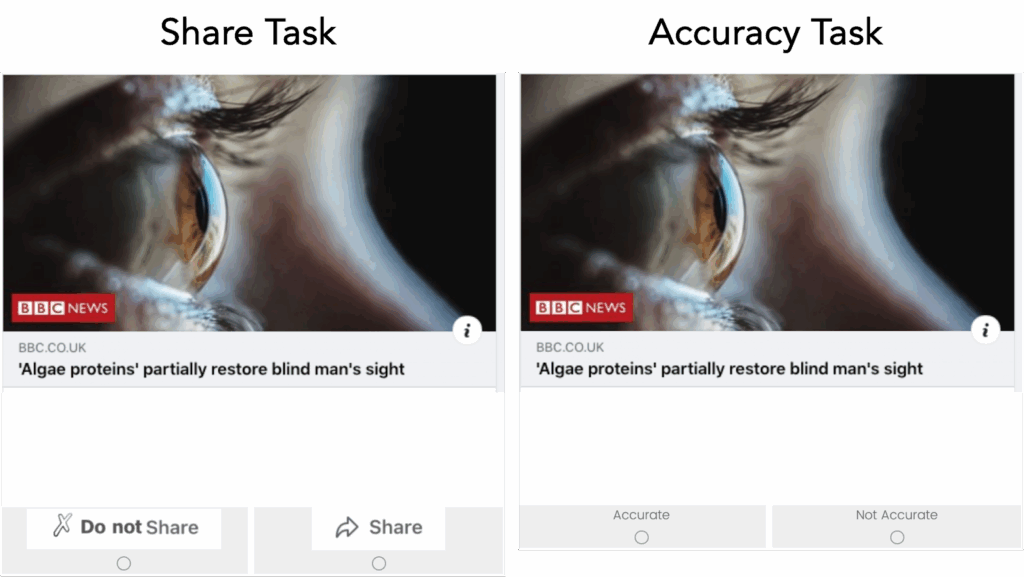
After completing both tasks, participants completed several measures. Of those measures, the only important one for understanding Study 2 was the news sharing habit measure. This measure asked participants to answer four questions on a 7-point scale (1 = disagree; 7 = agree):
- Sharing news on Facebook is something I do without thinking
- Sharing news on Facebook is something I do automatically
- Sometimes I start sharing news on Facebook before I realize I’m doing it
- Sharing news on Facebook is something I do without having to consciously remember
(Note: as described later, there was an error in the wording of one of these questions; the wording above is the wording the measure was reported in the paper to have had.)
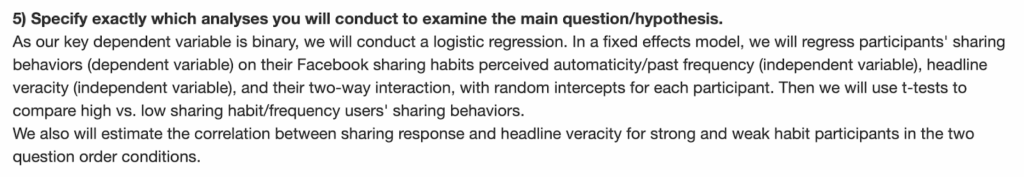
The primary analysis conducted on the data was a generalized linear mixed effects model that predicted whether participants chose to share or not share each headline by the three-way interaction between the following variables:
- Veracity: whether the news headline was true or false
- Condition: whether the participant completed the share task (control condition) or the accuracy task (treatment condition) first
- News Sharing Habit: the participant’s score on the news sharing habit measure
This analysis approach meant that discernment was assessed via the relationship between veracity and sharing. The more likely participants were to share true articles and not share false articles, the greater their discernment.
Study 2 reports the following results:
- no significant three-way interaction between veracity, condition, and news sharing habit
- a significant two-way interaction between veracity and news sharing habit, such that discernment (the relationship between veracity and sharing) was lower among participants with higher news sharing habit scores
- a significant two-way interaction between veracity and condition, such that discernment (the relationship between veracity and sharing) was higher when participants rated accuracy first
- a significant effect of condition, such that participants shared fewer headlines when they completed the accuracy task first
Study 2 also reports several direct comparisons of the amount of true and false news headlines shared between participants who had a news sharing habit score of at least one standard deviation below the average (“weak habitual sharers”) and participants one standard deviation above the average (“strong habitual sharers”).
Study 2 concludes by stating, “Thus, highlighting accuracy proved useful in reducing the spread of misinformation but not among the most habitual users. Echoing the first study, 15% of the strongest habit participants were responsible for sharing a disproportionate amount of misinformation—39% across all experimental conditions (habit estimated from SRBAI, 30% with habit estimated from past frequency).”
Our overall assessment of Study 2
The role Study 2 plays in the narrative of the paper is to claim that prompting social media users to consider accuracy does not cause habitual sharers to share less misinformation. In fact, the study’s title is “Considering Accuracy Does Not Deter Habitual Sharing: Study 2.” Here are other examples of this claim from the paper:
“Thus, highlighting accuracy proved useful in reducing the spread of misinformation but not among the most habitual users.”
“Once sharing habits have formed, they are relatively insensitive to changing goals through accuracy primes (4) and the display of metrics such as how many people scrolled over a post (29). Thus, existing individual-frame interventions remain relatively ineffective for the habitual sharers who are most responsible for misinformation spread on these platforms.”
Our conclusion is that this general claim is based on an incorrect interpretation of a nonsignificant 3-way interaction in a statistical model that had the following issues:
- It used a measure of news sharing habit that had an error in the question wording
- It was run on Amazon Mechanical Turk data that had no quality checks
- It did not converge
- It was underpowered
- It was not an analysis included in the preregistration (but was claimed to be)
Additionally, we found many issues with the reported results, including:
- Almost all of the numbers reported were model predictions, but were not stated to be so
- The reported results (which turned out to be model predictions) for weak habitual sharers are misleading because it was not possible for a participant to have a low enough sharing score to be considered a weak habitual sharer
- The way discernment was calculated may have inflated the differences between stronger and weaker habitual sharers
- Figure 3 is reported as being Study 1 data, but it appears to be created using Study 2 data
- There were many numbers we could not reproduce or that were calculated incorrectly
Many of these issues cannot be fully corrected without the collection of new data (e.g., the lack of data quality checks, the low statistical power, the lack of preregistration for the primary model). Although, in principle, a replication could solve these issues, we feel that there is insufficient conceptual clarity regarding the hypotheses and claims of the study to know what a replication should test. Additionally, given the number of errors we found, it is unclear what should count as successfully replicating the findings. Given these issues, we do not plan to conduct a replication of the study.
It is also important to note that after encountering the issues described above in Study 2, we did a quick review of the other three studies in the paper to see if they contained any of the most significant issues we detected in Study 2. We detected many of the same Study 2 issues in Studies 1 and 3, but fewer issues in Study 4. Nevertheless, Study 4 still contained several minor instances of some of the Study 2 issues and also had some numerical errors.
The next section provides specific details for all of the issues we encountered in the paper.
Study and Results in Detail
Description of issues with Study 2
After reading through the paper and trying to reproduce the results from Study 2 using the original data and analysis code, we encountered many issues with the implementation, analysis, reporting, and interpretation of the study. The following issues are described in detail in the subsections below:
- The primary claims don’t match the provided evidence
- The primary claims are based on statistical results that could be unreliable
- There was an error in one of the key measures
- Participants were not evaluated with quality checks
- The statistical model failed to converge
- Central claims rely on null results, but the study is likely underpowered
- The preregistration was not followed, but was claimed to have been followed
- Most numbers supplied in the paper are model predictions, not direct descriptions of the data
- The way discernment was calculated may have inflated the difference between strong and weak habitual sharers
- The study contains errors and numbers we cannot reproduce
- Figure 3 reports the wrong study’s data and contains errors
- There were many numbers we could not reproduce
- There were many issues in the analysis code
We consider the fact that the primary claims don’t match the provided evidence to be the most significant individual issue.
We think the next most significant issues are that (a) Amazon Mechanical Turk participants were not evaluated with quality checks, (b) the study regularly discusses “low habitual sharers,” who are a group that cannot exist because they are defined as having a News Sharing Habit score that is below the lowest possible score (explained in the section titled “Most numbers supplied in the paper are model predictions, not direct descriptions of the data”), and (c) the way discernment was calculated may have inflated the difference between strong and weak habitual sharers.
While the remaining issues are more minor, we think that the quantity and diversity of issues is perhaps the biggest concern for this study because it is difficult to tell how they, collectively, impacted the study results.
That said, it is important to point out that the authors of the original paper disagree about the severity of many of the issues we describe. You can see their full response here, and we have included each point they make at the end of every corresponding section in our report.
The primary claims don’t match the provided evidence
The main claim put forward in Study 2 is stated in the study’s title: “Considering Accuracy Does Not Deter Habitual Sharing: Study 2.” The paper makes several similar claims when discussing the results from Study 2:
- “Thus, highlighting accuracy proved useful in reducing the spread of misinformation but not among the most habitual users.”
- “Priming accuracy concerns prior to sharing had only a modest impact on the discernment of everyone and did not ameliorate high habitual sharing of misinformation (Study 2).”
- “Once sharing habits have formed, they are relatively insensitive to changing goals through accuracy primes”
As a reminder, the claims are based on a statistical model (a generalized linear mixed effects model) that predicted whether participants shared a given news headline by the three-way interaction between headline veracity (i.e., whether the news headline was true or false), experimental condition (i.e., share task first or accuracy task first), and the participant’s score on the news sharing habit measure. The following results from this model were reported in the paper:
- no significant three-way interaction between veracity, condition, and news sharing habit
- a significant two-way interaction between veracity and news sharing habit, such that discernment (the relationship between veracity and sharing) was lower among participants with higher news sharing habit scores
- a significant two-way interaction between veracity and condition, such that discernment (the relationship between veracity and sharing) was higher when participants rated accuracy first
- a significant effect of condition, such that participants shared fewer headlines when they completed the accuracy task first
The full fixed-effects results of the model are shown in the table below:
| Predictors | Log-Odds | Std. Error | z value | p value |
|---|---|---|---|---|
| Headline veracity | 1.07 *** | 0.25 | 4.31 | <0.001 |
| News sharing habit | 0.82 *** | 0.06 | 13.08 | <0.001 |
| Experimental condition | -0.49 *** | 0.13 | -3.66 | <0.001 |
| Headline veracity ×News sharing habit | -0.29 *** | 0.06 | -5.01 | <0.001 |
| Headline veracity × Experimental condition | 0.40 ** | 0.13 | 3.16 | 0.002 |
| News sharing habit × Experimental condition | 0.02 | 0.09 | 0.19 | 0.847 |
| Headline veracity ×News sharing habit ×Experimental condition | 0.03 | 0.08 | 0.35 | 0.723 |
| * p<0.05 ** p<0.01 *** p<0.001 | ||||
Taken at face value, the non-significant three-way interaction means that the study did not find evidence that the experimental condition affected the relationship between participants’ news sharing habit scores and their sharing discernment. Here’s another way of thinking about this: According to the results from the statistical model, people with higher news sharing habit scores showed worse discernment than people with lower habitual sharing scores and the model did not find strong evidence that asking people to rate accuracy first changed this difference in discernment between higher and lower habitual sharers.
However, the non-significant three-way interaction does not mean that “considering accuracy does not deter habitual sharing.” For example, imagine that rating accuracy first caused a large and equal increase in discernment for every single participant. This would not produce a significant three-way interaction because higher habitual sharers would still show relatively worse discernment than lower habitual sharers. But, it would have still improved discernment for higher habitual sharers—it just would have also improved discernment for low habitual sharers.
The study does, however, come close to interpreting the results correctly elsewhere: “In general, rating accuracy first did not increase the discernment of strongly habitual users any more than less habitual ones.” This interpretation is not perfectly correct because it interprets the null result as evidence of no difference (i.e., “did not increase the discernment”). This is a very common error in scientific papers, encapsulated by the adage, “absence of evidence is not evidence of absence” (Aczel et al., 2018). That aside, the paper’s interpretation does, in this instance, correctly note that the three-way interaction speaks to whether the experimental condition had different effects on participants’ sharing discernment depending on their Sharing Habit Scores.
In sum, the provided evidence does not support the titular claim, “Considering Accuracy Does Not Deter Habitual Sharing: Study 2.” Similar claims should be revised to reflect the finding that the experimental condition caused participants to be more discerning (on average) and that the study did not find evidence that this differed by participants’ news sharing habit scores.
In communication with the authors after drafting this report, they noted:
We interpreted the lack of three-way interaction based on the data pattern I shared with you in the reactions document.
You are making a thought experiment but frankly, you can just examine the pattern of the data.
The data is showing us that everybody (both high and low habitual users) their sharing slightly, supporting the lack of three-way interaction.
(Note that the referenced “reactions document” refers to the document linked to in the “Response from the Original Authors” section.)
The primary claims are based on statistical results that could be unreliable
In addition to the primary claims not matching the provided evidence, we identified several methodological and statistical issues that suggest that the results from the main analysis may not be a reliable test of the primary questions of interest.
As a reminder, the statistical model used in Study 2 is a generalized linear mixed effects model and one of the central claims in the study is based on a null result for the three-way interaction between headline veracity, experimental condition, and news sharing habit score.
The five issues we identified—an error in the news sharing habit measure, an Amazon Mechanical Turk sample that wasn’t vetted for response quality, a generalized linear mixed effects model that didn’t converge, low statistical power, and a preregistration that wasn’t followed—suggest that interpretation of the null result on the three-way interaction that the primary claims in Study 2 rely on should be done cautiously, if at all.
The subsections below explain each of these five issues in detail.
There was an error in the news sharing habit measure
The primary claims in this study concern how people’s decisions about whether to share news headlines differ depending on their scores on the news sharing habit measure. This measure is described in the paper as follows:
“In all studies, habit strength was measured with four 7-point scales (1 = never to 7 = always, adapted from the self-report habit index, (36): “Sometimes I start sharing news on Facebook before I realize I’m doing it,” “Sharing news on Facebook is something I do without thinking,” “Sharing news on Facebook is something I do automatically,” and “Sharing news on Facebook is something I do without having to consciously remember.” The items were averaged into a composite measure of habit strength (ɑ = 0.89).”
As can be seen in the publicly available materials for Study 2, one of the four sharing habit questions mistakenly says “reading” instead of “sharing” in the survey:
This error was mentioned by at least three participants in comments they provided at the end of the survey. For example, one participant said:
“There is one matrix that asks about your news sharing, specifically how automatic sharing/reading news is. The first battery was all about reading news,. The second matrix was mostly about sharing news, but there was one that was about reading news, that I think may have been an error (not changed when the question was copied/pasted)”
Given this error, one of the four questions that comprised a key independent variable for Study 2 measured a different psychological construct. In theory, this should make the news sharing habit measure a worse measure of participants’ news sharing habits.
In communication with the authors after drafting this report, they noted:
As you pointed out, there is a typo in one of the measures. However, all 4 items in the scale are highly correlated. If you drop this item, you will see that the results still hold. We also used other habits measures (reading habits and frequency of sharing). While reading habits are a weaker predictor compared to sharing habits but the results hold using any of these scales.
Amazon Mechanical Turk participants were not evaluated with quality checks
Study 2 recruited 839 participants from Amazon Mechanical Turk, and used the responses from all 839 participants in the analyses.
Amazon Mechanical Turk is an online crowdsourcing platform that is well-known for having high proportions of inattentive and/or fraudulent participants (i.e., bots or people who click through surveys at random in order to receive study payments) (see Chmielewski & Kucker, 2020; Stagnaro et al., 2024; Webb & Tangney, 2022). It is still a useful platform for collecting data, but careful quality checks are needed to weed out unreliable participants (Cuskley & Sulik, 2022). The Transparent Replications team has a lot of experience running studies on similar web-based platforms, and we find that it is common to have high rates of spam if no quality checks are implemented. This study did not use any quality checks, so a portion of the data could be noise from people or bots randomly clicking through the study. All else equal, adding random noise to a dataset will make null results more likely (e.g., for the three-way interaction tested in the statistical model).
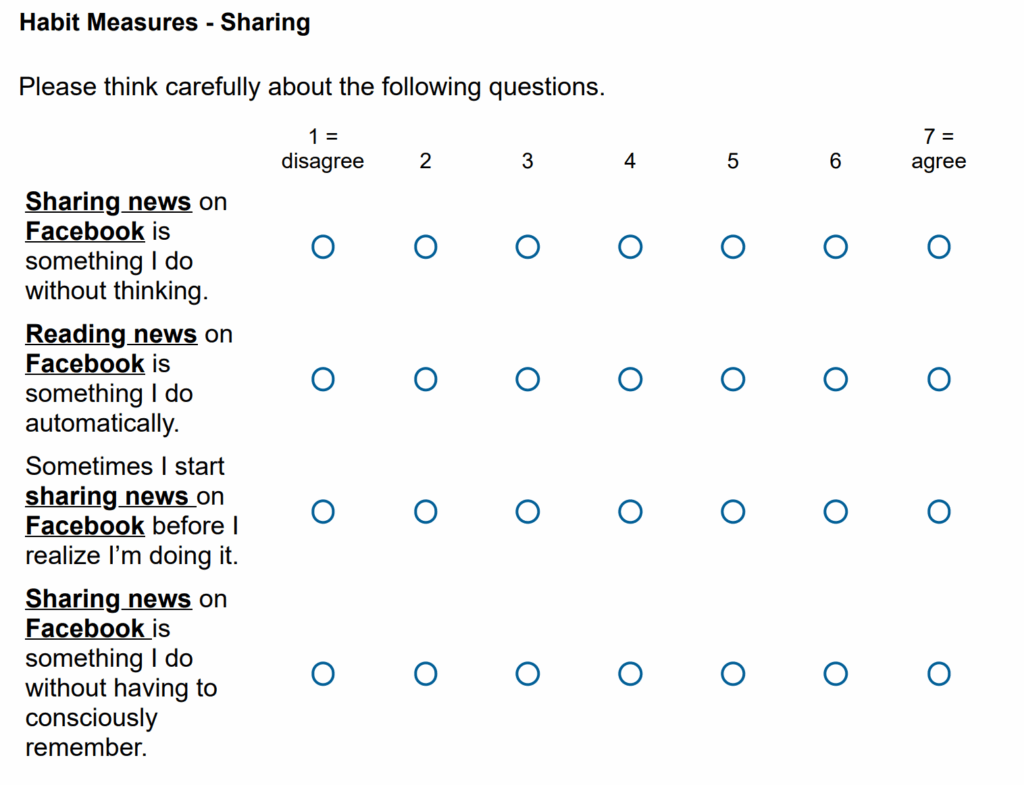
Moreover, Study 2 finds that participants with higher news sharing habit scores tend to be less discerning—i.e., they are worse at distinguishing between true news and false news—compared to those with lower news sharing habit scores. If a group of inattentive participants took this survey completely at random, one would expect them to have an average news sharing habit score of about 4 (the midpoint of the scale) and to not discern between true and false news headlines. The distribution of scores on the news sharing habit measure is highly skewed such that most participants have very low scores:
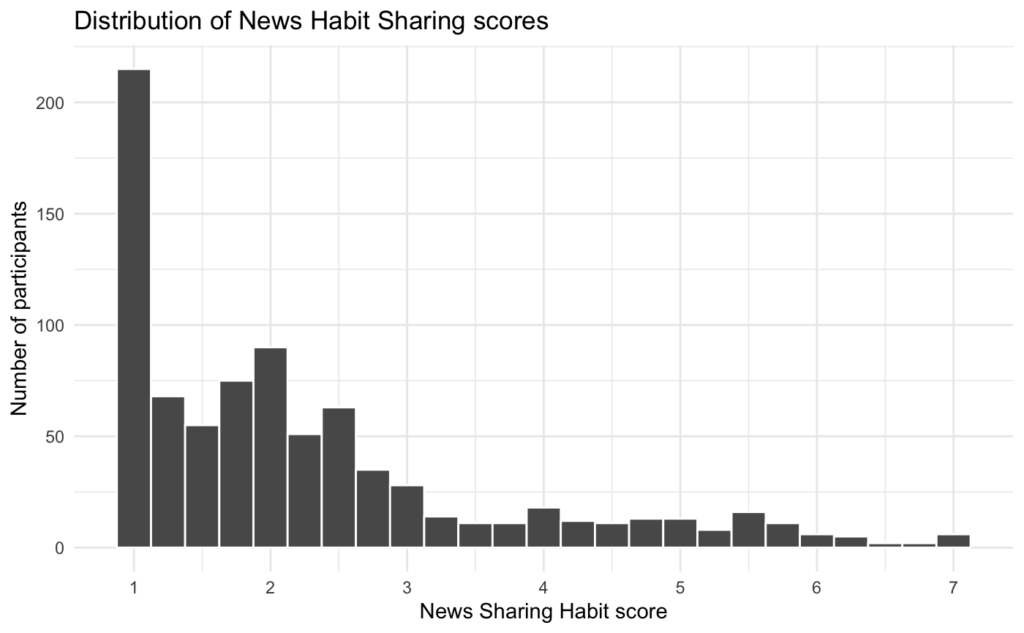
So, scores around the midpoint of the scale are “high” relative to most participants. As such, having a group of inattentive participants might make it more likely that you would find the effect that participants with higher news sharing habit scores tend to be less discerning.
To be clear, this does not mean that the effect observed in Study 2 was generated by inattentive participants—we cannot know without knowing which participants were inattentive. However, it demonstrates one of the issues with not using data quality checks.
In communication with the authors after drafting this report, they noted:
We have replicated these results many, many times, and it is implausible that the result is due to noise instead of habit strength. We even built habits in Study 4 to demonstrate causality of the effect. We have included quality checks such as attention checks and elimination of duplicate ip addresses in subsequent research, and we have obtained comparable results to those in the set of studies published in PNAS.
The statistical model failed to converge
Generalized linear mixed effects models estimate many parameters, and thus will sometimes fail to converge on a solution. When a model fails to converge, the results can be inaccurate. So, it’s good practice to resolve convergence errors to ensure the model results are reliable (Seedorff et al., 2019). The version of the model run in Study 2 failed to converge and, judging by the code shared by the authors, there were no attempts to find a version of the model that successfully converged to ensure the results were accurate.
In communication with the authors after drafting this report, they noted:
We computed many models including participants and headline fixed effects and decided to report the most comprehensive and conservative model. We also computed a model without random effects, and with an optimizer (control = glmerControl(optimizer = “bobyqa”). In all these cases, models converged and results remained virtually identical. The consistent results despite different models attest to the robustness of the effect. We did not include these in the web appendix because our focus was on reporting the other models including the various covariates requested by reviewers.
Central claims rely on null results, but the study is likely underpowered
When describing the statistical power for Study 2, the paper states,
“For Studies 2 and 3, with multiple experimental conditions, we increased the sample size to 400 per condition. With 16 stimuli and a sample size of 400 per condition, these studies have a power of at least 0.75 to detect an effect (d) of approximately 0.45.”
To put the effect size of d = 0.45 into context, we can examine Figure 3 in the paper, which shows the size of the relationship between the amount of false news participants shared and various measures used throughout this paper:
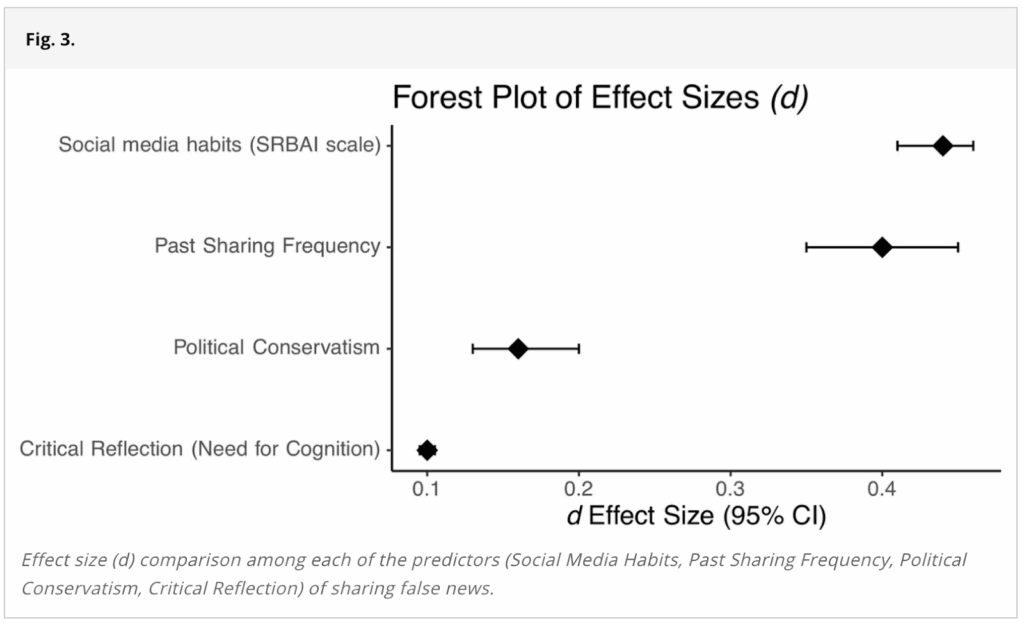
The two largest effect sizes come from the news sharing habit measure (referred to as “Social media habits (SRBAI scale)” in the figure) and Past Sharing Frequency. Because the amount of false news shared is measured in the study as the number of false headlines shared—not as the amount of false news relative to true news shared—one would expect the news sharing habit measure and Past Sharing Frequency to have a strong relationship with the amount of false news participants shared. After all, both measures tap into how readily participants share news. If people share more news, they will likely share more false news articles, in total. The effect size for both of these measures was less than d = 0.45.
(Note: The structure of the paper implies that the data in Figure 3 come from Study 1. However, we are confident that this data is in fact from Study 2, which we explain in detail later. As such, the news sharing habit measure has the wording error discussed earlier. This could have affected the effect size presented in Figure 3.)
The main claims in Study 2 rest on a nonsignificant three-way interaction between the news sharing habit measure, the experimental condition, and the veracity of the news headline. It seems unlikely that a three-way interaction between these variables would exceed the effect size of the simple relationship between the news sharing habit measure and the amount of false news one shares. As such, we think this statistical model was likely underpowered to detect a significant effect for the three-way interaction.
Improving the statistical power of this study would likely require including more stimuli. As Westfall et al. (2014) demonstrate, statistical power for study designs and statistical models like the ones used in this paper depend equally on how many participants and how many stimuli are used in the study. In other words, having low numbers of participants or stimuli can put an upper bound on the achievable statistical power. As shown in Figure 2 of Westfall et al. (2014), if a study has 16 stimuli, increasing the number of participants beyond 200 does very little to increase the statistical power.
In communication with the authors after drafting this report, they noted:
The power analysis we reported is for the focal effect, which is the interaction between habits scale and headline veracity. We are able to detect this effect even with 200 participants. Since we added a between-subjects variable (question order), we increased the sample size 4 times, which is in line with standard practices in the field. New approaches to power analysis with mixed effects offer various recommendations on how to calculate power. Even a recent paper suggests that power analysis does not lead to reliable results especially for mixed effect models (Pek, Pitt, and Wegener 2024).
Pek, J., Pitt, M. A., & Wegener, D. T. (2024). Uncertainty limits the use of power analysis. Journal of Experimental Psychology: General, 153(4), 1139.
The preregistration was not followed, but was claimed to have been
The paper says, “We preregistered all hypotheses, primary analyses, and sample sizes (except Study 1).” Study 2 was indeed preregistered, but the preregistered hypotheses and analyses were not what was reported in the paper.
Here is the hypothesis section of the preregistration:
According to this section, Study 2 was concerned only with the relationships between habitual sharing and false news sharing and between habitual sharing and “truth discernment.” (Note: we assume “truth discernment” was meant to be “sharing discernment” given the context of the preceding sentence in the preregistration. “Truth discernment” generally refers to correctly identifying headlines as true or false, whereas “sharing discernment” generally refers to preferentially sharing true headlines over false headlines.)
There were no hypotheses related to the experimental manipulation of prompting participants to share first or rate accuracy first. Yet, the paper frames the experimental manipulation as central to the goals of Study 2. Study 2 opens with:
“One potential explanation for habitual sharing is that people share indiscriminately when they are not able or motivated to assess the accuracy of information. In this account, habitual sharers spread misinformation just because strong habits limit attention to accuracy. To test this possibility, we examined whether highlighting accuracy prior to sharing would reduce the habitual spread of misinformation and increase sharing discernment (4).”
And here is the analysis section of the preregistration:
The primary preregistered statistical model predicts participants’ sharing behaviors by the news sharing habit measure, headline veracity, and the interaction between the two. However, the primary statistical model reported in the paper predicts participants’ sharing behaviors by the news sharing habit measure, headline veracity, experimental condition, and all two-way and three-way interactions between those variables.
We think that the statistical model reported in the paper is a more parsimonious way to test the various relationships the authors appear interested in testing given the other preregistered analyses. It is possible the authors came to the same conclusion after preregistering this study. However, the primary purpose of preregistering analyses in advance is to limit analytical flexibility. Thus, if deviations from the preregistration are made, the original preregistered analyses should still be reported and analyses that were not preregistered need to be labeled as such. Instead, this paper claimed, “We preregistered all hypotheses, primary analyses, and sample sizes (except Study 1).”
Since the primary analysis was not preregistered and there were no preregistered hypotheses related to the experimental condition, we think the results from this model are less likely to be reliable.
In communication with the authors after drafting this report, they noted:
This is an interesting claim. Our central prediction was for a two-way interaction. We did not expect that this effect would be modified by question order, and thus we did not specify the three-way interaction in the preregistration. Instead, we outlined the core, central effect we expected to be significant. We are unaware of any guidelines specifying that nonsignificant effects need to be preregistered.
Summary of reasons why the statistical results might be unreliable
Taken together, these five issues—an error in a key measure, an Amazon Mechanical Turk sample that wasn’t vetted for response quality, a model that didn’t converge, low statistical power to detect effects under d = 0.45, and a preregistration that wasn’t followed—cast doubt on whether the null result on a three-way interaction that the primary claims in Study 2 rely on should be interpreted as evidence for the study’s claims.
Most reported numbers were model predictions, but were not stated as such
The paper frequently reports numbers for Study 2 that sound like descriptive statistics. For example:
- “Habitual participants shared 42% of the true headlines and 26% of the false headlines”
- “weak habit participants were 1.9 times more discerning than strong habit ones”
- “rating accuracy first reduced participants’ sharing of false headlines (Maccuracy first = 9%; Msharing first = 13%)”
- “15% of the strongest habit participants were responsible for sharing a disproportionate amount of misinformation—39% across all experimental conditions”
Additionally, the figure used to represent the results from Study 2 (Figure 4), depicts the probability of sharing true and false headlines among “strong” and “weak” habitual sharers in the two experimental conditions:

The most straightforward interpretation of statements like, “Habitual participants shared 42% of the true headlines and 26% of the false headlines” is that if you tallied up the number of true and false headlines that habitual participants shared, you would find that they shared 42% of the true headlines and 26% of the false headlines.
However, as far as we can tell from the results generated by the authors’ analysis code, almost every number reported in Study 2 comes from the fixed effects results from the generalized linear mixed effects model they ran or estimated marginal means calculations for specific values of the dependent variables. In other words, almost all of the numbers provided in Study 2 are model predictions.
One of the biggest issues this presents for Study 2 is that many of the statistics reported are for a group of participants that cannot exist.
The paper often contrasts “strong habitual sharers” and “weak habitual sharers.” For example, Figure 4 (shown above) directly compares strong habitual sharers (green bars) to weak habitual sharers (blue bars). To define these groups, the study considers all participants whose score on the habitual sharing measure is at least one standard deviation above the mean as strong habitual sharers and all those whose score is at least one standard deviation below the mean as weak habitual sharers.
However, in this sample of participants, the news sharing habit measure, which ranged from 1-7, had a mean of 2.26 and a standard deviation of 1.40. So, one standard deviation below the mean was a score of 0.87. However, the lowest possible score on the scale was 1. So, no participant could have had a score of at least 1 standard deviation below the mean. The figure below shows the distribution of scores on the sharing habit measure, with the cut-offs for the strong and weak habitual sharers.
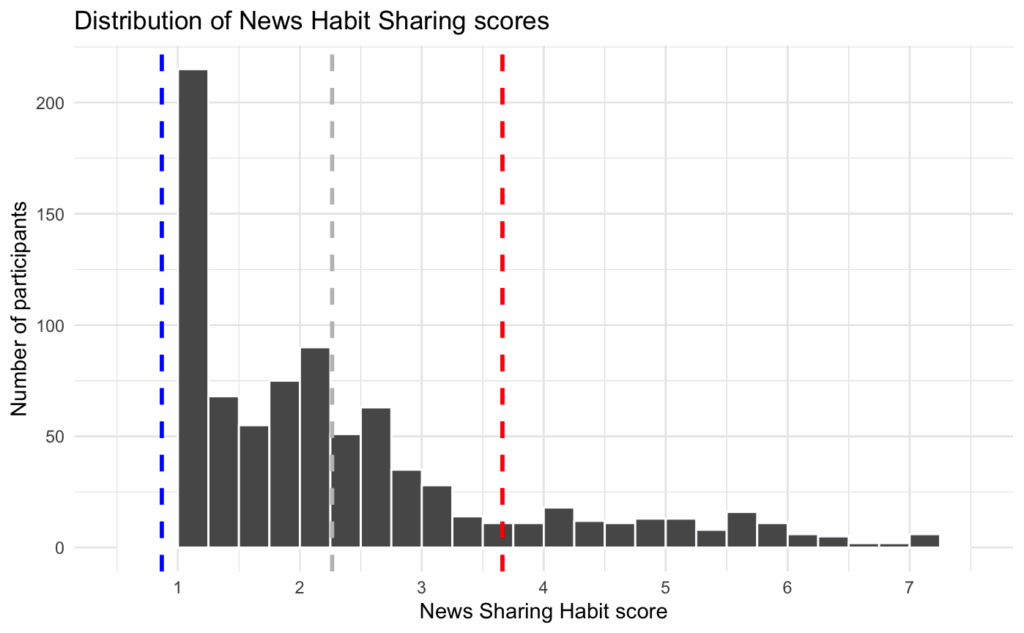
So, statements like “Less habitual participants shared 13% of the true headlines and 3% of the false headlines” are misleading, because it was impossible for a participant to meet the criterion for being a “less habitual participant.”
More generally, if you calculate statistics directly from the data, instead of using model predictions, many of the numbers are quite different. For example, the figure below compares the numbers provided in the study’s main figure for strong habitual sharers (in yellow-green), side-by-side with the actual data for strong habitual sharers (in gray). (Note: we did not plot bars for weak habitual sharers because there are no weak habitual sharers in the actual data.)
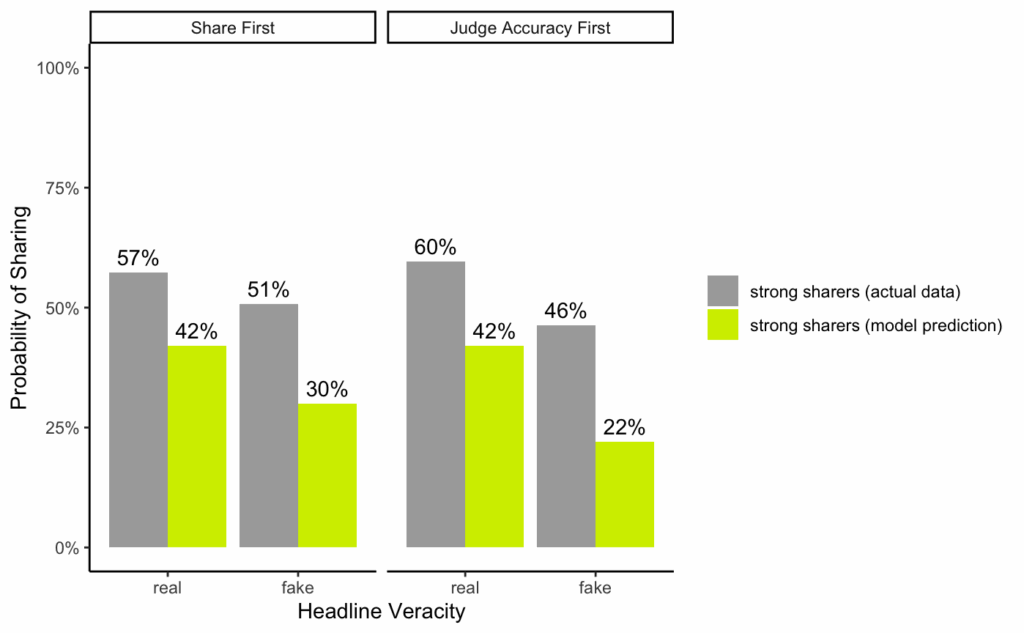
As shown in the figure, for each of the estimates for strong habitual sharers, the model prediction data was between 15 and 24 percentage points different from the actual data.
Although there is nothing wrong, in principle, with only reporting model predictions, we think the way this study reported model predictions led to three major issues.
First, the study provides statistics about a group of participants that do not exist (“weak habitual sharers”).
Second, the study does not specify that the reported numbers are model predictions. It only became apparent to us that the reported numbers were model predictions after trying to reproduce all of the numbers in the paper. We think readers would assume that descriptions about how often participants shared news headlines would be numbers calculated directly from the study data.
Third, using model predictions instead of actual descriptive statistics is a less direct approach to measuring what the study purports to measure. For example, the model predictions about how often participants shared false news were reported instead of how often participants actually shared false news.
In communication with the authors after drafting this report, they noted:
Since we used the prediction model, we can still report 1 SD deviation below the mean. Technically, this is an appropriate way to analyze the data. More importantly, the results are nearly identical if we compare the predicted probabilities at sharing habit 1 and sharing habit 0.87 (-1SD below the mean). An alternative way to analyze the data would be determining Johnson Neyman points. But this approach would not have changed any of our conclusions, as shown by the results below
| Sharing habit | Predicted probabilities of sharing – Fake | Predicted probabilities of sharing – Real |
| Control condition (share-first) | ||
| 0.87 (reported) | 0.05415136 | 0.15707102 |
| 1 | 0.07847644 | 0.19628033 |
| Treatment condition (accuracy-first) | ||
| 0.87 (reported) | 0.04381390 | 0.16599442 |
| 1 | 0.04824283 | 0.17620217 |
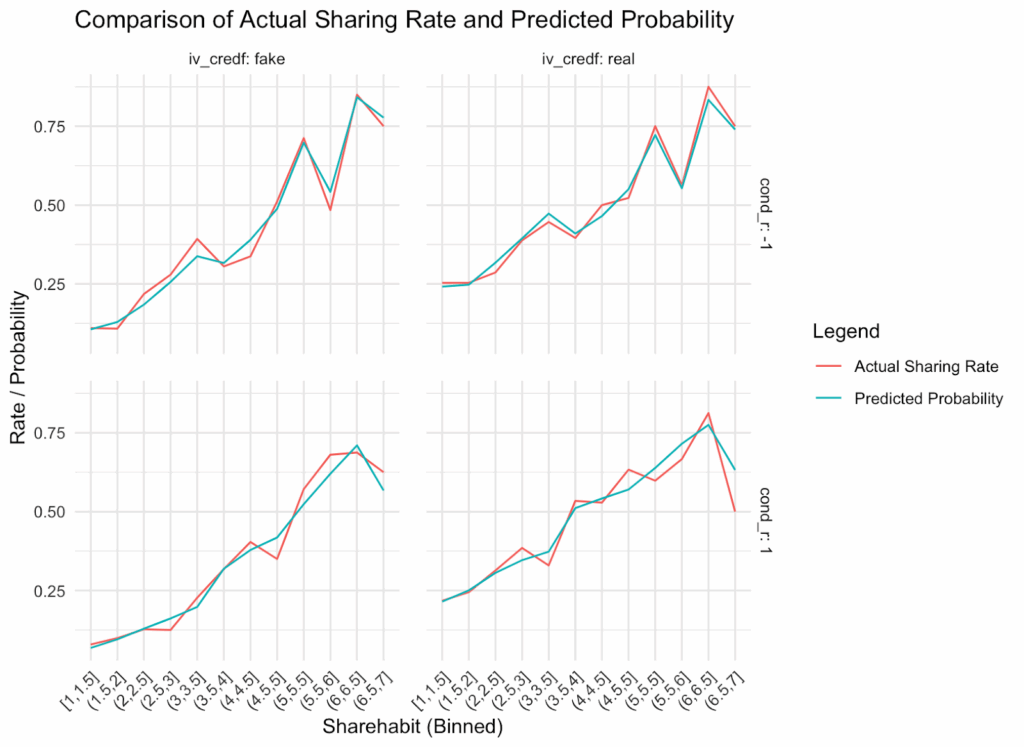
We reported predicted probabilities, and these are clearly marked in our graphs. However, I plotted predicted and actual sharing at every habit bin. As you can see, on average, they are aligned, which simply means that our model successfully recovered the data. They are aligned across the different question order conditions and for real and fake headlines. If anything, in the accuracy first condition (cond_r = 1), actual sharing seems slightly ahead of predicted sharing especially for fake headlines at high levels of habits. In general, the area under the curve is pretty similar for predicted and actual values.
The way discernment was calculated may have inflated the difference between strong and weak habitual sharers
The primary outcome of interest in the paper is participants’ sharing discernment. We believe the way it was calculated may have inflated the difference between strong and weak habitual sharers.
Conceptually, in the context of misinformation, sharing discernment can be thought of as the tendency to share news that is true and not share news that is false. Given this, there are at least two reasonable approaches to calculating discernment.
The first approach is to assess how the veracity of a news headline affects each decision to share or not share the headline. Higher discernment, in this case, would mean that headlines are more likely to be shared when they are true (and less likely to be shared when they are false). This is the general approach used by this paper (and many other misinformation papers).
The second approach is to simply calculate, for each participant, what proportion of their decisions were the “discerning decision” (i.e., sharing a news headline when it is true or not sharing a news headline when it is false). Scores closer to 1 would signify participants who are more discerning (i.e., made the discerning decision a higher proportion of the time) and scores closer to 0 would signify participants who are less discerning (i.e., made the discerning decision a lower proportion of the time).
In many cases, it shouldn’t matter which approach is used. Both approaches conceptualize discernment similarly—sharing a true headline and not sharing a false headline are discerning decisions, and sharing a false headline and not sharing a true headline are non-discerning decisions. However, we believe that the first approach presents an issue in this particular study.
In brief, the issue stems from two features:
- This study tests whether participants who have different news sharing habits have different levels of discernment
- Participants who have higher news sharing habits tend to share a medium amount of news headlines, while participants who have lower news sharing habits tend to share a small amount of news headlines.
These two features, when combined with the underlying assumptions of the statistical test, can make it appear that the group who shares a small amount of news headlines is more discerning than the group who shares a medium amount of articles—even if both groups make the exact same proportion of discerning decisions. If you want to read about the statistical reasons for this, see the appendix section titled “Additional information about the issue with how discernment was calculated.”
To illustrate this issue, we simulated data to mirror the structure of the data in Study 2. We simulated 839 participants who decided whether to share or not share 8 true headlines and 8 false headlines (same as the original study). We gave each participant a 50-50 chance of being a strong habitual sharer or a weak habitual sharer.
We then created three different scenarios:
Scenario 1:
- every strong habitual sharer decided to:
- share 5 true headlines and not share 3 true headlines
- share 4 false headlines and not share 4 false headlines
- every weak habitual sharer decided to:
- share 2 true headlines and not share 6 true headlines
- share 1 false headline and not share 7 false headlines
Scenario 2:
- every strong habitual sharer decided to:
- share 7 true headlines and not share 1 true headline
- share 6 false headlines and not share 2 false headlines
- every weak habitual sharer decided to:
- share 2 true headlines and not share 6 true headlines
- share 1 false headline and not share 7 false headlines
Scenario 3:
- every strong habitual sharer decided to:
- share 7 true headlines and not share 1 true headline
- share 6 false headlines and not share 2 false headlines
- every weak habitual sharer decided to:
- share 5 true headlines and not share 3 true headlines
- share 4 false headlines and not share 4 false headlines
Discerning decisions are denoted by green text and non-discerning decisions are denoted by red text.
Note, that this means that every single participant, across all three scenarios, made the exact same number of discerning decisions (9) and non-discerning decisions (7). Additionally, every participant shared the same net number of true headlines—the number of true headlines shared was one more than the number of false headlines shared.
The only difference between strong and weak habitual sharers in each scenario was that strong habitual sharers always shared more headlines in total than the weak habitual sharers did.
We then ran a generalized linear mixed effects model (the same type of statistical model used in the paper) that predicted whether participants shared the headline by the interaction between the veracity of the headline (true or false) and whether participants were in the strong or weak habitual sharer group. This analysis, like the one used in the paper, uses the first approach to calculating discernment described above.
The table below shows the odds ratios and associated p-values for the effect of this interaction in each of the three scenarios.
| Scenario | Odds ratio | p-value | Interpretation |
|---|---|---|---|
| Scenario #1 Strong: shared 5 true, 4 false Weak: shared 2 true, 1 false | 1.40 | <0.001 | Weak habitual sharers have better discernment than strong habitual sharers |
| Scenario #2 Strong: shared 7 true, 6 false Weak: shared 2 true, 1 false | 1.00 | 1.00 | There was no statistically significant difference in discernment between strong habitual sharers and weak habitual sharers |
| Scenario #3 Strong: shared 7 true, 6 false Weak: shared 5 true, 4 false | 0.71 | <0.001 | Weak habitual sharers have worse discernment than strong habitual sharers |
What these simulations show is that the sheer number of headlines the different groups shared mattered for the model’s evaluation of which group had better discernment (so much so that the results flipped direction between Scenarios #1 and #3). This happened even though every single participant made the same proportion of discerning decisions.
In Scenario 1, where weak habitual sharers shared very few headlines (3 of 16) and strong habitual sharers shared a medium amount of headlines (9 of 16), the results of the model suggest that weak habitual sharers have better discernment. This scenario is similar to the pattern of sharing observed in the real data.
But in Scenario 3, where weak habitual sharers shared a medium amount of headlines (9 of 16) and strong habitual sharers shared a high amount of headlines (13 of 16), the results flipped, suggesting that weak habitual sharers have worse discernment.
Whereas in Scenario 2, when weak and strong habitual sharers were on perfectly opposite sides of the sharing distribution (sharing 3 of 16 versus 13 of 16), there was an odds ratio of exactly 1, suggesting no difference between weak and strong habitual sharers.
So, it’s not the case that comparing high versus low habitual sharers has to lead to weak habitual sharers appearing to have higher discernment—it depends on the amount of total sharing each of these groups does.
If discernment had instead been calculated as the proportion of times participants made the discerning decision (the second approach discussed early on in this section), there would be exactly zero difference in discernment between the strong habitual sharers and weak habitual sharers in all three of these scenarios.
Of course, the simulation we ran was different from the actual study in several meaningful ways:
- The statistical model in Study 2 treated news sharing habits as a continuous variable, not a binary variable
- The statistical model in Study 2 also included the effect of experimental condition
- In our simulation, participants labeled as strong habitual sharers always shared more news headlines than participants labeled as weak habitual sharers. In the actual Study 2 data, because the news sharing habit measure was self-report, it was possible for participants to score highly on the measure but share very few headlines in the actual study (and vice versa)
As such, using the real Study 2 data, we calculated a discernment score for each participant as the proportion of times they made the discerning decision (i.e., the second approach to calculating discernment discussed above). We then ran a linear regression predicting these discernment scores by experimental condition, news sharing habit scores, and the interaction between the two. (We structured this model to be as conceptually close to the original model as possible.) This allowed us to see whether the effect size found using the original analytical approach might be inflated, as our simulations suggest.
We found results that were directionally similar to those of the original model—people in the accuracy condition tended to show greater discernment, people who had higher news sharing habit scores tended to show lower discernment, and no significant interaction between condition and news sharing habit scores on discernment:
| Variable | Coefficient | Std. Error | p-value | Interpretation |
|---|---|---|---|---|
| Condition (accuracy first vs share first) | 0.009 | 0.004 | 0.031* | Participants in the accuracy-first condition tended to show greater discernment |
| News sharing habit score(scale of 1-7) | -0.006 | 0.003 | 0.035* | Participants who had higher news sharing habit scores tended to show lower discernment |
| Condition * News sharing habit score (the interaction between condition and news sharing habit) | 0.004 | 0.003 | 0.149 | There was no statistically significant evidence that the effect of condition on participants’ discernment differed by participants’ news sharing habit scores |
However, the effects observed in this new model were, arguably, much weaker than the effects in the original model.
It is important to note that it is difficult to precisely compare the size of the relationship between discernment and news sharing habit scores observed in the original model and our model. Primarily, this is because the models are estimating different quantities—log-odds of sharing an article in the original model and proportion of discerning decisions made in the new model.
However, we can look at a couple different indicators to get a rough sense of how they compare. First, the p-value for this relationship in the original model is <0.001, whereas it is 0.035 in the new model. Second, if we standardize the model coefficient for the relationship between discernment and news sharing habit score (the coefficient that has a value of -0.006 in the model results above), the standardized coefficient has a value of -0.41 in the original model, but -0.07 in the new model.
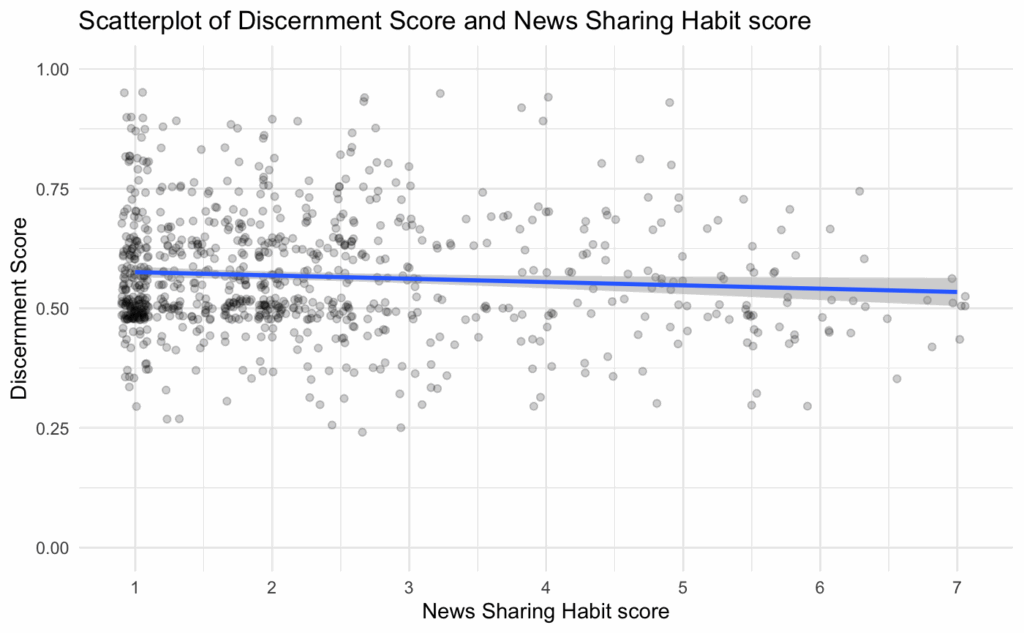
Perhaps the best way to get an intuition for the effect size found in the new model is to see the relationship between participants’ news sharing habit scores and their discernment plotted:

According to the results of the new model we ran, the expected difference in discernment score between someone with the lowest news sharing habit score (score of 1) and someone with the highest news sharing habit score (score of 7) is 0.036 (on average, all else equal). In other words, the strongest possible habitual sharers would be expected to make a discerning decision 3.6% less often than the weakest possible habitual sharers. This effect size feels at odds with descriptions in the paper, such as “As predicted, and replicating Study 1, strongly habitual participants continued to share with limited sensitivity to the veracity of headlines.”
In sum, it appears that the analytical approach used throughout the paper to assess discernment may have caused inflated effect sizes because of the fact that stronger habitual sharers tended to share a medium amount of the headlines while weaker habitual sharers tended to share very few of the headlines. That said, the general finding that higher habitual sharers had worse discernment held even when calculating discernment differently. The effect was just weaker.
The study contains errors and numbers we cannot reproduce
Throughout Study 2, there were several instances where the numbers reported in the paper differed from the numbers we reproduced with the authors’ data and code. Sometimes, these deviations were caused by identifiable errors, but other times we could not identify what led to the differences. The deviations were usually small and inconsequential, but the frequency of numbers we could not reproduce was concerning and could suggest that there are other errors we did not detect. This section will not provide an exhaustive list of these issues, but will highlight a handful.
Figure 3 reports the wrong study’s data and contains errors
Figure 3 in the paper (see figure below) is reported as displaying results from Study 1. However, the publicly available code for Study 2 has a section at the end that creates Figure 3. If you run that code using the data from Study 2, it perfectly recreates this figure. Thus, it appears that Figure 3 displays results from Study 2, despite the paper suggesting that these results are from Study 1.
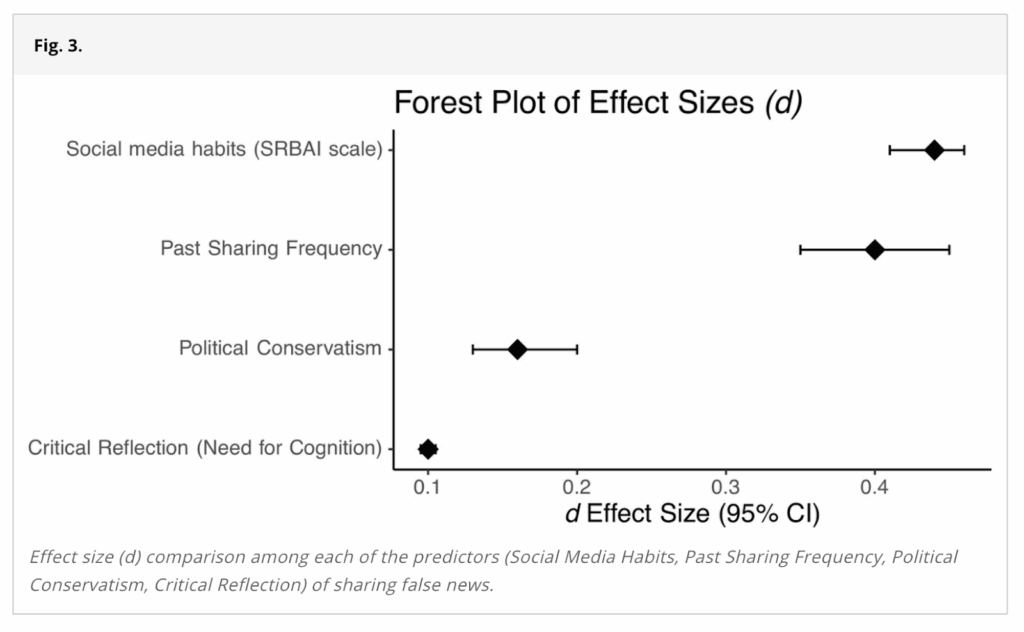
In addition to using data from the wrong study, there are a few errors in Figure 3.
First, the magnitude of the effect size value for “Critical Reflection (Need for Cognition)” is miscalculated (as described in detail later in this section).
Second, the effect size for “Critical Reflection (Need for Cognition)” should be in the opposite direction from the other other measures (there is a negative relationship between sharing false news and Critical Reflection, whereas the other variables have a positive relationship with sharing false news). It would be reasonable to present these effect sizes as absolute values, but it was not specified in the paper that these were absolute values.
Third, the 95% confidence interval for the effect of ‘Critical Reflection (Need for Cognition)’ appears to be extremely narrow. The generalized linear mixed effects model used to estimate this effect did not converge, which likely caused the implausibly narrow confidence interval. The model output shows a confidence interval width of zero, and the z-value for Critical Reflection is -834.71, suggesting that the effect estimate is 834 standard deviations away from zero (see the first screenshot below).
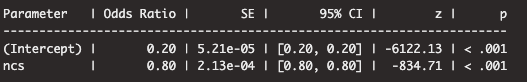
Such an extreme z-value is implausible and suggests that the model’s fit is problematic. This is the type of issue that can arise with mixed effects models that don’t converge, which is concerning since most of the mixed effects models run in Study 2 (including those reported in the supplementary information) do not converge. The 95% confidence interval for the effect of ‘Critical Reflection (Need for Cognition)’ should almost certainly have a width greater than 0.
There were many numbers we could not reproduce
There are many numbers reported in Study 2 that we cannot reproduce. This report does not document every such instance both for the sake of time and because, even if the numbers were reproducible, they would still suffer from all of the issues noted above.
But, as an example of numbers we could not reproduce, take the numbers reported in the main figure for Study 2:

These numbers appear to be estimated marginal means that were calculated to compare the average probability of sharing in each experimental condition, broken down by the four possible combinations of weak habitual sharers versus strong habitual sharers and true headlines versus false headlines. Here is a screenshot of the results from the authors’ code that we believe was used to calculate these values:
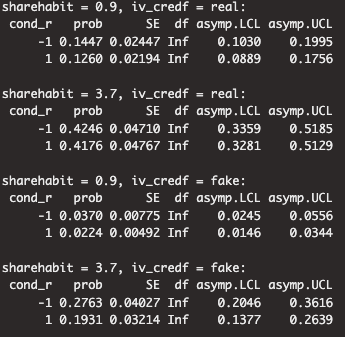
Here’s how to read these results:
- “Sharehabit = 0.9” refers to weak habitual sharers
- “Sharehabit = 3.7” refers to strong habitual sharers
- “iv_credf = real” refers to true headlines
- “iv_credf = fake” refers to false headlines
- “cond_r = 1” refers to the judge accuracy first condition (treatment condition)
- “cond_r = -1” refers to the share first condition (control condition)
So, for example, the bottom value in the screenshot of 0.1931 should be the value shown in the Figure for strong habitual sharers when evaluating false headlines in the judge accuracy first condition. The value in the figure is 22%, but these results suggest it should be 19%. There are a couple of other values in the figure that are off by a few percentage points, but several of the other values in the figure align with the results in the screenshot.
The numbers used to create the Figure 4 plot were hard-coded in the authors’ code, so we cannot be certain where they came from. Our best guess is that these discrepancies were either a transcription error or that a slightly different version of the model was run and used to calculate the numbers for the plot, and then the model was updated at a later point but these numbers were not.
It is also worth discussing the numbers mentioned in the Figure 4 caption. The caption states, “In the sharing first condition (4A), weak habit participants were 2.2 times more discerning than strong habit ones. In the judge accuracy first condition (4B), this difference reduced slightly to 1.7 times.” We did not find these numbers calculated in the analysis code, and at first we were not able to reproduce them because we assumed they were based on the numbers in the figure. Eventually, however, we were able to arrive at the stated numbers if we did the following: First, calculate the marginal effect of headline veracity on the likelihood of sharing for both weak and strong habitual sharers in both the share first condition and the judge accuracy first condition. Second, convert the odds ratios from this analysis into d values. Third, compare the d values for weak and strong habitual sharers in the share first condition to arrive at the number 2.2, and compare the d values for weak and strong habitual sharers in the judge accuracy first condition to arrive at the number 1.7. If that is how these numbers were calculated, it seems unclear to describe them as how many “times more discerning” some participants are than others. This is also an example of why it can be difficult to reproduce specific numbers if they are not explicitly calculated in the analysis code.
It is important to note that failure to reproduce specific numbers is not necessarily due to errors in the paper. It is possible that we made mistakes when attempting to reproduce the numbers or that numbers were calculated through a complex procedure that was not documented, as illustrated by the example above. There are also more benign reasons for irreproducible numbers, such as packages used in the analysis code that changed between the time the analyses were originally run and the time we ran them.
There were many issues in the analysis code
Even though our inability to reproduce some numbers does not necessarily reflect issues with the paper, the analysis code had several issues that suggest that some of the difficulty reproducing numbers could be because of the code.
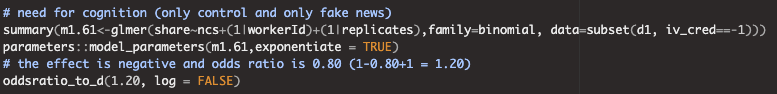
First, the code did not allow for seamless reproduction of the analyses. It seemed to have been written to run on a different version of the data because it called column numbers that do not exist in the publicly available version of the data. (However, the authors very promptly shared the raw data file with us when we asked, which allowed us to identify the columns in question.) There were also typos in model names and variable names, and variables called that weren’t created until later in the script. This suggests that the script was never run all the way through, which can be a cause of irreproducible numbers.
Second, there were calculation errors in the code that did or could have led to reporting incorrect numbers. For example, the analysis for the Critical Reflection effect in Figure 3 discussed above yields an odds ratio of 0.80 (suggesting a negative effect). The analysis code specifies that this was converted to an odds ratio for a positive effect of the same magnitude by using the formula “(1-0.80+1 = 1.20)” (see screenshot below). This is not the correct way to convert odds ratios. The correct conversion would be 1 / .80 = 1.25. This incorrect odds ratio was then converted to a d effect size and reported in Figure 3.
Third, there were some results reported for Study 2 in the supplement for which there was no code in the analysis script (specifically, the section titled “Supporting Text S2: Study 2 Predicting Truth Judgment from Three-Way Interaction Models”).
Collectively, these issues suggest that some of the irreproducible numbers reported in the paper could have come from errors in the code.
Summary of issues discovered in Study 2
In sum, through the process of trying to reproduce the results from Study 2, we encountered many issues with the implementation, analysis, reporting, and interpretation of the study, including:
- The primary claims don’t match the provided evidence
- The primary claims are based on statistical results that could be unreliable
- There was an error in one of the key measures
- Participants were not evaluated with quality checks
- The statistical model failed to converge
- Central claims rely on null results, but the study is likely underpowered
- The preregistration was not followed, but was claimed to have been followed
- Most numbers supplied in the paper are model predictions, not direct descriptions of the data, which causes comparisons with an “impossible” group of participants
- The way discernment was calculated may have inflated the difference between strong and weak habitual sharers
- The study contains errors and numbers we cannot reproduce
(Later in the report, we detail some similar issues that we encountered in the other studies in the paper.)
We consider the most significant individual issue in Study 2 to be that the primary claims don’t match the provided evidence. Even if there were no other issues in the paper, incorrect claims cause the paper (and thus readers) to draw incorrect conclusions from the provided evidence.
We think the following three issues are the next most significant.
(a) The fact that Amazon Mechanical Turk participants were not evaluated with quality checks seems particularly problematic for this study because, as explained in the section “Participants were not evaluated with quality checks,” inattentive/spam participants could make it more likely to find a null result for the three-way interaction, while also making it more likely to find a relationship between participants’ News Sharing Habits and their discernment.
(b) The study regularly discusses “low habitual sharers,” who are a group that cannot exist because they are defined as having a News Sharing Habit score that is below the lowest possible score (as explained in the section titled “Most numbers supplied in the paper are model predictions, not direct descriptions of the data”). This causes the results presented in the study to be, in our view, misleading because high habitual sharers (a group that exists in the study) are regularly compared against low habitual sharers (a group that does not exist in the study)—for example, Study 2 states, “weak habit participants were 1.9 times more discerning than strong habit ones.”
(c) As argued in the section “The way discernment was calculated may have inflated the difference between strong and weak habitual sharers,” the observed relationship between News Sharing Habit and discernment is much smaller when calculated using an approach that doesn’t suffer from the statistical artifact we identified. Although the general relationship described in the paper is still present when correcting for this, we think the smaller effect size makes it unclear if the effect is practically meaningful. We say “unclear” because we acknowledge that assessing whether an effect size is “meaningful” is challenging and, ultimately, a subjective judgment.
While the remaining issues are more minor, and may not individually affect the general pattern of results, we think that the overall quantity and diversity of issues is perhaps the biggest concern for this study because it is difficult to tell how they, collectively, impacted the study results.
Although, in theory, a replication could address some of these issues with Study 2, we have decided not to replicate the study. This decision is explained in the next subsection.
Why we are not replicating Study 2
The primary reason we are choosing not to replicate Study 2 is that it is unclear precisely what Study 2 was trying to test.
Broadly, Study 2 examines the relationships between whether people share a news headline, the veracity of that headline, whether people are prompted to judge the accuracy of that headline before deciding whether to share it, and how people score on the news sharing habit measure.
The paper motivates Study 2 by stating:
“One potential explanation for habitual sharing is that people share indiscriminately when they are not able or motivated to assess the accuracy of information. In this account, habitual sharers spread misinformation just because strong habits limit attention to accuracy. To test this possibility, we examined whether highlighting accuracy prior to sharing would reduce the habitual spread of misinformation and increase sharing discernment.”
This suggests that the primary tests of interest should be whether the experimental manipulation—prompting participants to judge accuracy first or decide what to share first—causes habitual sharers to share less misinformation and improve their sharing discernment.
Yet, the three-way interaction tested in the primary statistical model assesses whether the experimental condition influenced sharing discernment differently for people depending on how habitual of a sharer they were. Based on the results, the paper states, “In general, rating accuracy first did not increase the discernment of strongly habitual users any more than less habitual ones.” Contrary to the stated motivation for Study 2, this analysis suggests that Study 2 aims to test whether rating accuracy first is more effective for habitual sharers than for non-habitual sharers.
The paper notes that the two-way interaction between headline veracity and the experimental manipulation is significant such that the accuracy intervention appeared to improve sharing discernment among the whole participant sample, on average. But it then concludes by stating, “Thus, highlighting accuracy proved useful in reducing the spread of misinformation but not among the most habitual users.” One way to interpret this statement is that the study is primarily focused on how the intervention affects the most habitual users, consistent with the stated motivation for the study. However, the paper never reports a statistical test that directly assesses whether the experimental manipulation improved the spread of misinformation among habitual users. So, our best guess is that this conclusion was an (incorrect) callback to the results of the three-way interaction.
The closest the study comes to assessing whether the experimental manipulation improved the spread of misinformation among habitual users is a plot (Figure 4) that purportedly shows the probability of participants sharing a headline, broken down by the headline’s veracity, the experimental condition, and whether the participant is a strong or weak habitual sharer:

On its face, this plot seems to show that the experimental manipulation led the strong habitual sharers to improve their discernment and share less false news—the probability of sharing was 42% for true news and 30% for false news in the Share First condition versus 42% for true news and 22% for false news in the Judge Accuracy First condition. (We do not recommend taking this plot at face value as described earlier in the report, but we highlight it because it was used as evidence in the paper for the study’s claims.) So, this figure seems to go against the conclusion from Study 2, “Thus, highlighting accuracy proved useful in reducing the spread of misinformation but not among the most habitual users.”
Between the stated goals of the study, the analyses conducted, the results presented, and the interpretations of the results, it is unclear to us what the study is trying to test. This is further complicated by the fact that the preregistration does not mention the experimental condition in its hypotheses. The hypotheses section centers on testing for differences in sharing behavior between habitual sharers and non-habitual sharers:

The preregistration suggests that there was no a priori motivation for including the experimental manipulation (although it could have been mistakenly left out of the preregistration).
Two smaller, but still important, challenges to the conceptual clarity of this study are caused by the variables used in the analyses.
First, throughout the paper, participants are discussed as being strong habitual sharers or weak habitual sharers. The framing around strong habitual sharers suggests that strong habitual users are a distinct type of person, whose sharing discernment needs to be improved (e.g., “habitual users were responsible for sharing a disproportionate amount of false information”). Study 2 seems particularly concerned with improving outcomes for strong habitual sharers.
Yet, judging from the distribution of scores on the news sharing habit measure (see figure below) as well as the relationship between the proportion of discerning decisions made and news sharing habit scores (see figure below), the data does not seem to motivate a special focus on those with scores +1 SD above the mean on the news sharing habit measure. Perhaps if there was a bimodal distribution of news sharing habit scores or if those with medium-to-high news sharing habit scores were far less discerning, then it would be straightforward to dichotomize participants into “strong” and “weak” sharers.

Although, the study splits participants into “strong” and “weak” habitual sharers and compares model predictions about headline sharing rates among these groups, the primary analysis in Study 2 treats habitual sharing as a continuous measure, and the study does not report any direct tests of the effect of the experimental manipulation on strong habitual sharers (as mentioned earlier). This makes it challenging to know whether the goal of this study is to assess the effects on strong habitual sharers, or whether the study is interested, more generally, in the relationship between sharing habits and sharing outcomes.
A second challenge to the conceptual clarity of the study is that sometimes the focus of a particular statistical test is sharing discernment, while other times it is the amount of false news shared. (While these are related concepts, they are not the same: one could reduce the amount of false news they share, but if they also proportionally reduce the amount of true news they share, they would have the same sharing discernment.) Because results for both are not always tested and/or reported, it is unclear whether Study 2 is always interested in outcomes for both or whether it depends on the test in question.
In sum, it is difficult to pin down what analysis one should run if they wanted to test the central hypotheses and verify the claims made in this study. Moreover, it is unclear what it would mean to “replicate” the results from the original study given that many of the reported results had errors or other issues. As such, we have decided not to replicate the study.
There are similar issues in the other studies in the paper
This paper has 4 studies in total. After encountering the issues described above in Study 2, we did a quick review of the other studies to see if some of the most significant issues we detected in Study 2 were also present in the other studies.
The table below summarizes what we found. The first column lists each issue we assessed. The other columns indicate whether that issue was present in Studies 1, 3, and 4.
| Type of Issue identified in Study 2 | Issue present in Study 1? | Issue present in Study 3? | Issue present in Study 4? |
|---|---|---|---|
| There was an error in the news sharing habit measure | Issue present | Issue not present | Issue not present |
| Amazon Mechanical Turk participants were not evaluated with quality checks | Issue present | Issue present | Issue not present |
| The statistical model failed to converge | Issue not present | Issue present | Issue somewhat present |
| Central claims rely on null results, but the study is likely underpowered | N/A | N/A | Issue somewhat present |
| The preregistration was not followed, but was claimed to have been | N/A | Issue present | Issue somewhat present |
| Most reported numbers were model predictions, but were not stated as such | Issue present | Issue present | Issue somewhat present |
| The cut-off value to qualify as a weak habitual sharer is impossible for any participant to score | Issue present | Issue present | N/A |
| The primary claims don’t match the provided evidence | Issue not present | Issue somewhat present | Issue somewhat present |
In the subsections below, we provide details for each of the issues indicated by this table. To fully understand how these issues may have impacted the results in Studies 1, 3, and 4, we recommend reading through these studies in the original paper to understand the study designs and reported results.
Studies 1 & 3
Studies 1 & 3 were quite similar to Study 2 and had many of the same issues as those identified in Study 2. The table below explains the issues in detail.
| Type of Issue identified in Study 2 | Issue present in Study 1? | Issue present in Study 3? |
|---|---|---|
| There was an error in the news sharing habit measure | Issue present – According to the publicly shared survey file for Study 1, the same wording error identified in Study 2 was present in Study 1 | Issue not present – According to the publicly shared survey file for Study 3, the wording error identified in Study 2 was not present in Study 3 |
| Amazon Mechanical Turk participants were not evaluated with quality checks | Issue present – Participants did not appear to be evaluated with any quality checks. This poses the same issues as it did in Study 2—namely, that participants selecting options at random would be expected to have higher news sharing habit scores, on average, than most participants (given the right-skewed distribution). Participants choosing at random would also be expected to show less discernment, on average. | Issue present – Participants did not appear to be evaluated with any quality checks. This poses similar issues as it did in Study 2—namely, that participants selecting options at random would be expected to have higher news sharing habit scores, on average, than most participants (given the right-skewed distribution). Participants choosing at random would also be expected to show less of a bias towards sharing headlines that align with their reported political leanings, on average. |
| The statistical model failed to converge | Issue not present – The primary statistical model did not fail to converge | Issue present – The primary statistical model failed to converge |
| Central claims rely on null results, but the study is likely underpowered | N/A – The claims don’t rely on a null result | N/A – The claims don’t rely on a null result |
| The preregistration was not followed, but was claimed to have been | N/A – Study 1 was not preregistered | Issue present – there were several discrepancies between the preregistered analyses and those reported in the paper, including: (a) not preregistering using headline veracity as one of the key predictors in the model; (b) not preregistering that all participants who identified as political moderates would be dropped from the model; (c) it was preregistered that the same model would be tested with a different dependent variable (sharing frequency), but those results were not reported in the paper |
| Most reported numbers were model predictions, but were not stated as such | Issue present – Many of the descriptive statistics provided appear to be model predictions. For example, the paper reports: “those with stronger habits (+1 SD) shared a similar percentage of true (M = 43%) and false headlines (M = 38%)…” These numbers are model predictions rather than the actual percentage of headlines shared by those with stronger habits. | Issue present – Many of the descriptive statistics provided appear to be model predictions. For example, the paper reports: “weak habit participants (−1 SD) shared more concordant (M = 21%) than discordant headlines (M = 3%)…” These numbers are model predictions rather than the actual percentage of headlines shared by weak habit participants. |
| The cut-off value to qualify as a weak habitual sharer is impossible for any participant to score | Issue present – the cut-off value of participants’ news sharing habit score to qualify as a weak habitual sharer (one standard deviation below the mean) was 0.79. The lowest possible value participants could have is 1. | Issue present – the cut-off value of participants’ news sharing habit score to qualify as a weak habitual sharer (one standard deviation below the mean) was 0.47. The lowest possible value participants could have is 1. |
| The primary claims don’t match the provided evidence | Issue not present – the claims were correct interpretations of the model results | Issue somewhat present – Many of the claims matched the model results, but there were issues with at least two claims: (a) this claim was not directly tested and is not obvious from the plotted data: “Even when rating the political orientation of headlines before sharing, habitual sharers were less discriminating in the politics of what they shared.” (b) this claim goes beyond what the study assessed: “our findings reveal that sharing misinformation is part of a broader response pattern of insensitivity to informational outcomes that results from the habits formed through repeated social media use.” |
Study 4
Study 4 used a substantively different study design from Studies 1-3 and did not seem to have the same quantity or severity of issues as those identified in Study 2. The table below explains the issues in detail.
| Type of Issue identified in Study 2 | Issue present in Study 4? |
|---|---|
| There was an error in the news sharing habit measure | Issue not present – The news sharing habit measure did not have a wording error |
| Amazon Mechanical Turk participants were not evaluated with quality checks | Issue not present – Participants who did not pass a manipulation check were excluded from analyses |
| The statistical model failed to converge | Issue somewhat present – The primary model converged, but the model used to make the following claim did not converge: “Finally, training had comparable influence on the sharing of weak and strong habit participants as measured by our two indices of habit strength (SI Appendix, section 20).” |
| Central claims rely on null results, but the study is likely underpowered | Issue somewhat present – Most claims did not rely on a null result, but the following claim did: “Finally, training had comparable influence on the sharing of weak and strong habit participants as measured by our two indices of habit strength (SI Appendix, section 20).” Although the statistical power for Study 4 was not reported, we can infer that it couldn’t have been higher than Study 2 (which was reported to have 75% power to detect an effect of d = .45) since Study 4 had fewer participants and the same number of stimuli for this analysis. |
| The preregistration was not followed, but was claimed to have been | Issue somewhat present – The primary preregistered analysis was mostly followed. However, the preregistration does not specify testing an interaction between headline veracity and experimental condition, even though the primary reported model does test this. But, the hypotheses section of the preregistration predicts a significant interaction between these variables so it is likely that not specifying the interaction in the analysis was simply an error. Other minor deviations from the preregistered analyses include: (a) using estimated marginal means to assess simple effects instead of the preregistered t-tests (b) including random intercepts for stimuli in the model despite not preregistering this |
| Most reported numbers were model predictions, but were not stated as such | Issue somewhat present – Many of the descriptive statistics do not appear to be model results. However, there is a section where the means for three different measures of participants’ goals for sharing information are reported. These values appear to be model predictions calculated using estimated marginal means. Fortunately, the actual means and the model-predicted means only differ by between 0.01 and 0.15 on a 1-7 scale. |
| The cut-off value to qualify as a weak habitual sharer is impossible for any participant to score | N/A – The study does not binarize news sharing habit scores into low and high habitual sharers. |
| The primary claims don’t match the provided evidence | Issue somewhat present – Many of the claims match the model results, but the following two claims treat a null result as evidence for no effect: “training had comparable influence on the sharing of weak and strong habit participants as measured by our two indices of habit strength (SI Appendix, section 20).” “our proposed intervention impacted both weakly and strongly habitual users—the ones who are disproportionately responsible for spreading misinformation on social platforms. Thus, this intervention had broad effects.” |
We did not try to fully reproduce all of the results for Studies 1, 3, & 4 as we did for Study 2. However, in the course of checking whether Study 4 contained any of the same major issues as Study 2, we came across a number of minor errors, as well. Although we think these errors do not affect the high-level pattern of results, they do add to our general concern about the reliability of the findings reported in the paper (to see examples of these errors, see the Appendix section titled “Additional information about errors detected in Study 4”).
Summary of issues in other studies
In sum, from a quick review of Studies 1, 3, and 4, we detected many of the same Study 2 issues in Studies 1 & 3, but fewer issues in Study 4. Nevertheless, Study 4 still contained several minor instances of some of the Study 2 issues and also had a handful of numerical errors.
Conclusion
Because of the issues we encountered when trying to reproduce the results reported in Study 2 (described above), we chose not to replicate the study. Based on a quick review, the other studies in the paper have some, but not all, of the same issues as Study 2. Study 2 did not receive a replicability rating since we did not attempt to replicate it.
The materials, pre-processed data, and analysis code were publicly available for Study 2. The analysis code did not successfully run on the provided pre-processed data, but the authors readily provided the raw data upon request. The study was preregistered, but the preregistered analyses were not followed and these deviations were not mentioned in the paper. The study received 3.75 stars for transparency.
The issues with Study 2 documented above led to unreliable results and/or incorrect claims. We think these issues will cause readers to come away with an inaccurate impression of what the study shows. The study received 0 stars for clarity.
Purpose of Transparent Replications by Clearer Thinking
Transparent Replications conducts replications and evaluates the transparency of randomly-selected, recently-published psychology papers in prestigious journals, with the overall aim of rewarding best practices and shifting incentives in social science toward more replicable research.
We welcome reader feedback on this report, and input on this project overall.
Author Response
Our feedback process with the original authors proceeded in a few rounds of communication. They are presented in order below.
First Round
The lead author submitted the following response on behalf of the authorship team. The numbered points correspond to the section in the report being addressed.
We appreciate you taking the time to analyze our paper.
However, we respectfully but firmly disagree with the majority of your critiques.
As detailed in our attached response, we have extensively replicated these findings across multiple studies using various measures and methods. While you correctly identified a typo in one habits measure, this does not impact our results’ robustness, as demonstrated through multiple replications and alternative measures.
Your analysis examines a single study in isolation, overlooking the paper’s comprehensive evidence across multiple studies that collectively support our conclusions. This approach does not align with standard scientific practice of evaluating evidence holistically.
We have provided detailed responses to each point raised and consider this matter closed. We respect your right to publish your analysis, though we believe doing so would not serve the scientific discourse productively.
Best,Gizem (on behalf of the authors)
- The study used a measure of news sharing habit that had an error in the question wording
As you pointed out, there is a typo in one of the measures. However, all 4 items in the scale are highly correlated. If you drop this item, you will see that the results still hold. We also used other habits measures (reading habits and frequency of sharing). While reading habits are a weaker predictor compared to sharing habits but the results hold using any of these scales.
- The study data were collected on Amazon Mechanical Turk with no quality checks
We have replicated these results many, many times, and it is implausible that the result is due to noise instead of habit strength. We even built habits in Study 4 to demonstrate causality of the effect. We have included quality checks such as attention checks and elimination of duplicate ip addresses in subsequent research, and we have obtained comparable results to those in the set of studies published in PNAS.
- The model did not converge
We computed many models including participants and headline fixed effects and decided to report the most comprehensive and conservative model. We also computed a model without random effects, and with an optimizer (control = glmerControl(optimizer = “bobyqa”). In all these cases, models converged and results remained virtually identical. The consistent results despite different models attest to the robustness of the effect. We did not include these in the web appendix because our focus was on reporting the other models including the various covariates requested by reviewers.
- The study was underpowered
The power analysis we reported is for the focal effect, which is the interaction between habits scale and headline veracity. We are able to detect this effect even with 200 participants. Since we added a between-subjects variable (question order), we increased the sample size 4 times, which is in line with standard practices in the field. New approaches to power analysis with mixed effects offer various recommendations on how to calculate power. Even a recent paper suggests that power analysis does not lead to reliable results especially for mixed effect models (Pek, Pitt, and Wegener 2024).
Pek, J., Pitt, M. A., & Wegener, D. T. (2024). Uncertainty limits the use of power analysis. Journal of Experimental Psychology: General, 153(4), 1139.
- Our central analysis was not included in the preregistration (but was claimed to be)
This is an interesting claim. Our central prediction was for a two-way interaction. We did not expect that this effect would be modified by question order, and thus we did not specify the three-way interaction in the preregistration. Instead, we outlined the core, central effect we expected to be significant. We are unaware of any guidelines specifying that nonsignificant effects need to be preregistered.
- Predicted probabilities 1SD below the mean
Since we used the prediction model, we can still report 1 SD deviation below the mean. Technically, this is an appropriate way to analyze the data. More importantly, the results are nearly identical if we compare the predicted probabilities at sharing habit 1 and sharing habit 0.87 (-1SD below the mean). An alternative way to analyze the data would be determining Johnson Neyman points. But this approach would not have changed any of our conclusions, as shown by the results below
| Sharing habit | Predicted probabilities of sharing – Fake | Predicted probabilities of sharing – Real |
| Control condition (share-first) | ||
| 0.87 (reported) | 0.05415136 | 0.15707102 |
| 1 | 0.07847644 | 0.19628033 |
| Treatment condition (accuracy-first) | ||
| 0.87 (reported) | 0.04381390 | 0.16599442 |
| 1 | 0.04824283 | 0.17620217 |
- Predicted probabilities vs. actual sharing
We reported predicted probabilities, and these are clearly marked in our graphs. However, I plotted predicted and actual sharing at every habit bin. As you can see, on average, they are aligned, which simply means that our model successfully recovered the data. They are aligned across the different question order conditions and for real and fake headlines. If anything, in the accuracy first condition (cond_r = 1), actual sharing seems slightly ahead of predicted sharing especially for fake headlines at high levels of habits. In general, the area under the curve is pretty similar for predicted and actual values.

(Ceylan, email published with permission, 1/26/2025)
In addition to this response, the authors also provided a follow up email response to our section in the report titled “the primary claims don’t match the provided evidence.” That response is below:
We interpreted the lack of three-way interaction based on the data pattern I shared with you in the reactions document.
You are making a thought experiment but frankly, you can just examine the pattern of the data.
The data is showing us that everybody (both high and low habitual users) their sharing slightly, supporting the lack of three-way interaction.
(Ceylan, email published with permission, 1/30/2025)
Transparent Replications Team Response to First Round
After receiving this response the Transparent Replications team included those points in the relevant sections of the report as well as at the end, and made changes to the executive summary clarifying the scope of our claims to make more clear that the Clarity rating is our attempt to evaluate the presentation of the evidence in the paper itself, and how likely a reader may be to misinterpret what is presented in the paper.
We communicated to the authorship team that we included their responses in the relevant sections of the report in order to allow their critique to speak for itself, without a reader having to get to the end of the report to see it.
Second Round
The original authorship team was not satisfied with the The Transparent Replications team’s level of engagement with their critique, and asked that we include the following statement:
“As the original authors, we are deeply disappointed by the level of engagement Clearer Thinking has demonstrated in this critique. Despite providing detailed clarifications and transparent analyses, the report persists in promoting conclusions that appear driven more by prior beliefs than a fair reading of the evidence. We view this as a significant misrepresentation of our work and not in line with the standards of rigorous scientific evaluation. We urge greater care and intellectual honesty in future engagements with scholarly work.”
(Ceylan, email published with permission, 4/1/2025)
Transparent Replications Team Response to Second Round
In response to this concern, our team drafted brief responses to each of the points raised by the original authorship team in the first round of feedback. Our response is below:
We appreciate you granting permission to share your responses, and will add the statement you request to the report. I wanted to address your concern about us not engaging enough with your comments and feedback.
We initially opted to simply share your comments as you wrote them in the report, rather than providing a response to them because we felt like it was most fair to offer readers your perspective alongside our perspective. After reading your message, I can see how that came across as us not engaging with your feedback, and I apologize for that. I wanted to offer a brief response to your feedback to give you more of a sense of why it didn’t result in more of a change to our report.
I think there may be a bit of a misunderstanding about our process and how we evaluate papers. Our Clarity evaluation of the study is focused fundamentally on how likely we believe readers are to come away with accurate impressions of the evidence presented in the paper from reading the paper itself. Several of your responses point to additional tests run by the authorship team that were not included in the paper, and other studies the team conducted on this topic. That is certainly valuable information for someone evaluating the claims about habits and misinformation made in the paper, and we’re happy to be able to include that information in our report. At the same time, that information doesn’t change our clarity rating which is about evaluating the evidence as it was presented in the paper itself, rather than how likely it is that the underlying hypotheses are true. Our goal in the revisions we made to the Executive Summary after your initial feedback was to make sure the scope of our claims is clearly defined.
With that said, the attached document contains our brief responses to your specific points. Again, apologies for not offering these before. Our intention is to include these responses following your responses at the very end of our report.
(Email from Metskas on behalf of TR team, 8/11/2025)
Appendices
Additional analyses we preregistered and ran on the original data
After we had first attempted to reproduce the analyses reported in Study 2, we thought that the primary analysis conducted in the paper—a generalized linear mixed effects model predicting headline sharing by the three-way interaction between veracity, condition, and news sharing habit—was an overly complex analysis given the stated goals of Study 2. So we decided to run what we considered to be the simplest valid analyses on the data.
After running these analyses, we uncovered other issues with the study (e.g., an error in the news sharing habit measure, no participant quality checks, low statistical power, mixed messages about what exactly the study is supposed to test) that led us to believe that the simplest valid analyses we ran were also probably unreliable and/or uninformative.
As such, we think these analyses should be taken with a grain of salt, but we include them here for transparency.
Description of the simplest valid analyses
The original paper stated the goal of Study 2 as follows:
“One potential explanation for habitual sharing is that people share indiscriminately when they are not able or motivated to assess the accuracy of information. In this account, habitual sharers spread misinformation just because strong habits limit attention to accuracy. To test this possibility, we examined whether highlighting accuracy prior to sharing would reduce the habitual spread of misinformation and increase sharing discernment.”
We thought that the most direct way to test the questions of interest in this study were to assess whether highlighting accuracy prior to sharing would:
- reduce the spread of misinformation among habitual sharers
- increase sharing discernment of habitual sharers
Because we interpreted this study as being primarily concerned with the effect of the accuracy intervention on the behavior of habitual sharers, we thought the simplest valid analyses should test only habitual sharers (those who had a news sharing habit score of at least one standard deviation above the mean). Since we were focusing only on habitual sharers, we did not use news sharing habit as an independent variable, which simplified the analyses.
Another way to simplify the analyses used in the paper was to create two scores for each participant:
- Spread of misinformation score: how much misinformation each participant shared, which we calculated as the proportion of the false headlines they shared
- Sharing discernment score: how discerning each participant was, which we calculated as the proportion of discerning sharing decisions they made—in other words, the proportion of true headlines a participant shared and the proportion of false headlines a participant did not share
Creating a single score for each participant meant that, instead of using generalized linear mixed effects models, we could run independent samples t-tests—a simpler statistical model. (The original paper’s approach treated each decision to share or not share as a single data point. This meant that each participant had multiple data points, which required a model that accounted for the clustering of observations within participants; e.g., a mixed effects model.)
Additionally, as discussed in the section titled “The study contains errors and numbers we cannot reproduce,” creating a single discernment score for each participant meant that we no longer needed to include veracity as an independent variable in the model.
In sum, this approach allowed us to run two simple analyses addressing what we interpreted as the questions of interest:
- Did highlighting accuracy prior to sharing reduce the spread of misinformation among habitual sharers? – tested via an independent samples t-test assessing whether habitual sharers’ spread of misinformation scores differed between experimental conditions
- Did highlighting accuracy prior to sharing increase sharing discernment of habitual sharers? – tested via an independent samples t-test assessing whether habitual sharers’ sharing discernment scores differ between experimental conditions
For comparison, we also ran versions of the original generalized linear mixed effects model used in the paper to test the two questions of interest. Here’s a description of these models:
- Did highlighting accuracy prior to sharing reduce the spread of misinformation among habitual sharers? – a generalized linear mixed effects model, run on only habitual sharers, predicting sharing as a function of condition, among only the 8 trials in which participants evaluated false headlines
- Did highlighting accuracy prior to sharing increase sharing discernment of habitual sharers? – a generalized linear mixed effects model, run on only habitual sharers, predicting sharing as a function of the interaction between headline veracity and condition
We preregistered these four analyses here (see preregistration for greater detail about the analyses, including random effects structure, variable coding, etc).
In brief, all four analyses found null results. Below are more detailed results.
Did highlighting accuracy prior to sharing reduce the spread of misinformation among habitual sharers?
Simplest valid analysis
The results of the independent samples t-test assessing whether habitual sharers’ spread of misinformation scores differed between experimental conditions indicated that there was no significant difference between the two groups, t(131.99) = 0.84, p = .400.
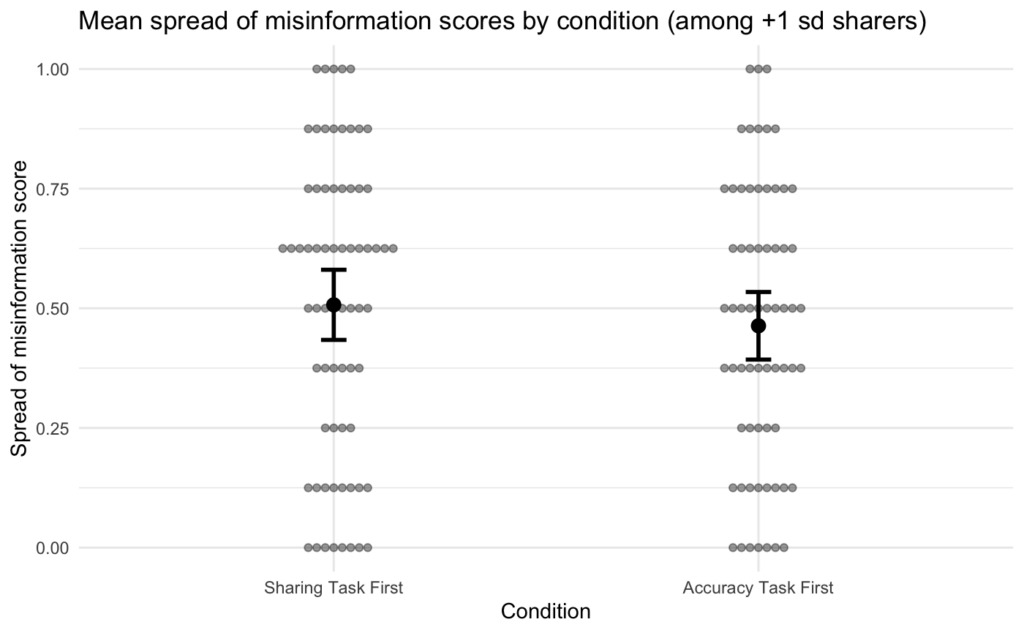
Generalized linear mixed effects model for comparison
The results of the generalized linear mixed-effects model (run on only habitual sharers) predicting sharing as a function of condition among only the 8 trials in which participants evaluated false headlines indicated that condition was not a significant predictor of sharing, b = -0.12, SE = 0.14, z = -0.82, p = .414.
Did highlighting accuracy prior to sharing increase sharing discernment of habitual sharers?
Simplest valid analysis
The results of the independent samples t-test assessing whether habitual sharers’ sharing discernment scores differ between experimental conditions indicated that there was no significant difference between the two groups, t(125.11) = -1.48, p = .141.
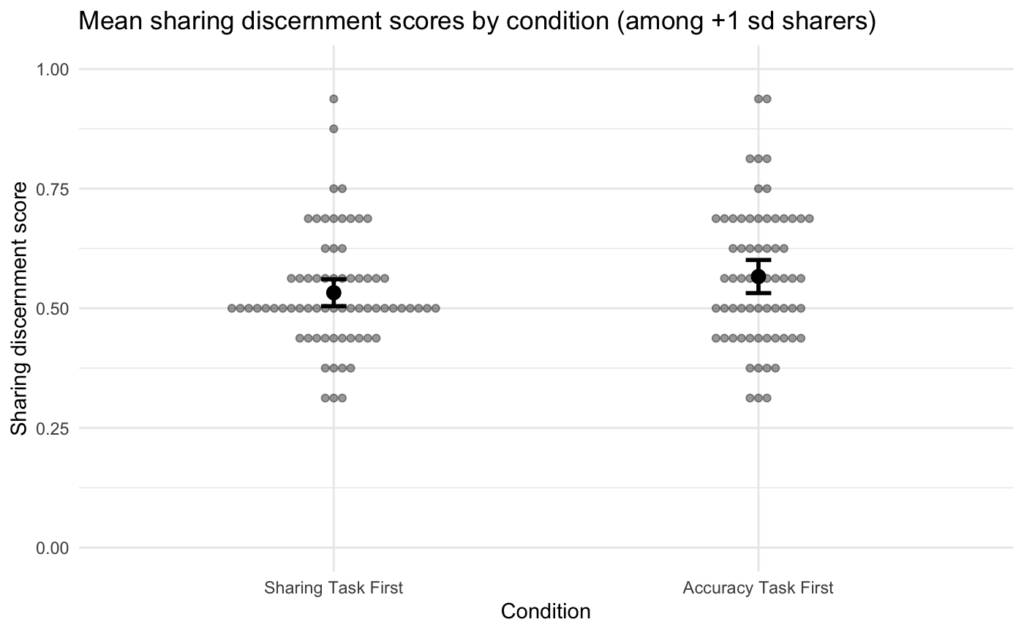
Generalized linear mixed effects model for comparison
The results of the generalized linear mixed-effects model (run on only habitual sharers) predicting sharing as a function of the interaction between headline veracity and condition indicated that the interaction between headline veracity and condition was not significant, b = 0.16, SE = 0.12, z = 1.34, p = .180.
Low statistical power
It is difficult to interpret the null results for each of these analyses because the analyses were likely underpowered.
Because only 134 of the 839 participants met the criteria for being a habitual sharer, according to sensitivity power analyses conducted with G*Power 3.1 (Faul et al., 2009), these t-tests only had 95% power to detect an effect size of at least d = .63 and 80% power to detect an effect size of at least d = .49. As discussed in the section titled “Central claims rely on null results, but the study is likely underpowered,” these effect sizes are quite large given other documented effects in the study.
Moreover, as discussed in the section titled “Central claims rely on null results, but the study is likely underpowered,” the primary model in the original study was probably underpowered, so the two generalized linear mixed effects models we ran that resembled the primary analyses, but only tested habitual sharers, were probably at least as underpowered.
Summary
We ran two preregistered analyses that met our criteria for simplest valid analyses and two preregistered comparison analyses designed to mirror the original analytical approach. These analyses found null effects. However, we do not think these results should be interpreted strongly given that they were underpowered and given the other issues we identified with Study 2 after completing these analyses (e.g., an error in the news sharing habit measure, no participant quality checks, mixed messages about what exactly the study is supposed to test). Nevertheless, we have reported the analyses here for full transparency.
Additional information about the issue with how discernment was calculated
Throughout the paper, discernment was calculated as the relationship between the decision to share a headline and the headline’s veracity. A stronger relationship between a headline being true and it being shared means greater discernment.
In order to assess the relationship between participants’ news sharing habits and discernment, the paper ran statistical models with the decision to share a headline as the dependent variable and the veracity of the headline, participants’ news sharing habit scores, and the interaction between the two as the independent variables.
In this model, a significant interaction between veracity and news sharing habit scores would suggest that people with different news sharing habit scores have different discernment levels.
Because the dependent variable in this statistical model is binary and because there are multiple trials per participant, the study uses a generalized linear mixed effects model. This class of model—generalized linear models—fit S-shaped curves (a sigmoid function) to the data when there are binary outcomes. These curves represent the predicted probabilities of a binary outcome.
In principle, this statistical approach makes sense for this data. The problem, however, is that participants who score low on the news sharing habit measure tend to share very few of the 16 headlines they see in the study, while participants who score high on the news sharing habit measure tend to share closer to half of the 16 headlines.
Under the hood, these types of statistical models do not estimate effects on the probability scale directly. Instead, they use a linear predictor (a weighted sum of predictors) that is then mapped onto probabilities using a sigmoid (S-shaped) function. This mapping is nonlinear: equal shifts in the linear predictor translate into different changes in probability, depending on whether the baseline probability is near 0%, near 50%, or near 100% (notice how the sigmoid curve is steeper in the middle and flatter at either end).
For participants who share very few articles, their baseline probability of sharing (regardless of veracity) may be close to the lower end of the S-curve. In this region, even a small linear increase in the underlying predictor—reflecting differences between true and false headlines—can translate into a relatively large proportional change in the odds of sharing because going from a very low probability to a slightly higher one represents a big relative jump. In contrast, participants who share about half of the articles start near the midpoint of the S-curve. Here, the same increase in the probability of sharing true headlines vs. false headlines represents a smaller proportional change in the odds of sharing.
To make this concrete, here’s an example. Suppose we have two groups, both making the same absolute difference in “discerning” behavior.
For simplicity, we’ll use one of the examples from the simulations we ran (discussed in the section titled “The way discernment was calculated may have inflated the difference between strong and weak habitual sharers”):
High Sharer Group:
- True headlines shared: 5 out of 8 = 0.625 probability
- False headlines shared: 4 out of 8 = 0.5 probability
- Absolute difference: 0.625 – 0.5 = 0.125
Low Sharer Group:
- True headlines shared: 2 out of 8 = 0.25 probability
- False headlines shared: 1 out of 8 = 0.125 probability
- Absolute difference: 0.25 – 0.125 = 0.125
On the raw probability scale, both have the same 0.125 difference in discerning behavior. Yet the model concludes that the low sharers are more “discerning.” Why? Because logistic regression doesn’t directly model probability differences. It models differences in log-odds:
logit(p) = log(p/(1-p))
If we compute the log-odds for these probabilities, we get:
High Sharer Group:
- For True: logit(0.625) = log(0.625/0.375) = 0.51
- For False: logit(0.5) = log(0.5/0.5) = log(1) = 0
- Difference in log-odds: 0.51 – 0 = 0.51
Low Sharer Group:
- For True: logit(0.25) = log(0.25/0.75) = -1.10
- For False: logit(0.125) = log(0.125/0.875) = -1.95
- Difference in log-odds: (-1.10) – (-1.95) = 0.85
So, even though both groups have the same 0.125 absolute difference in probability, the difference in log-odds is much larger for the low sharers (0.85) than for the high sharers (0.51).
This happens because, at extreme ends of the sigmoid function, a small absolute increase represents a much bigger relative change in odds.
In other words, the statistical model “sees” that for the low sharers, the difference between how they respond to true vs. false headlines is, in terms of log-odds, more pronounced. Even though the raw probability difference is the same, the low sharers look like they’re making a bigger relative change in their sharing behavior. This gets captured as a stronger effect of discernment in the model output.
So, in the example we provided, it’s not that one group truly has better or worse discernment. Rather, the nonlinear transformation imposed by the logistic model combined with different baseline sharing tendencies can cause identical levels of discernment to appear different once expressed as odds ratios. This phenomenon is a statistical artifact reflecting how the logistic curve and the odds ratio metric interact with varying baseline probabilities.
Additional information about errors detected in Study 4
As mentioned earlier in the report, we did not try to fully reproduce all of the results for Studies 1, 3, & 4 as we did for Study 2. However, in the course of checking whether Study 4 contained any of the same major issues as Study 2, we came across a number of minor errors, as well. Although we think these errors do not affect the high-level pattern of results, they do add to our general concern about the reliability of the findings reported in the paper. Below are three examples.
Minor error – example 1
The primary discernment effect sizes that are reported in Study 4 appear to be incorrect based on the results in the analysis script. Here is Figure 7 from Study 4, which reports the effect sizes of the probability of sharing false versus true headlines in each of the conditions:

These d effect sizes are calculated in the code by converting odds ratios to d values. These specific d values are arrived at by converting odds ratio values that are hard-coded in the analysis script:

However, there is no code in the analysis script that calculates those specific values of 12.64, 4.00, and 3.48. Moreover, the code immediately preceding this effect size conversion is code that appears to calculate the odds ratios for the comparisons of interest:
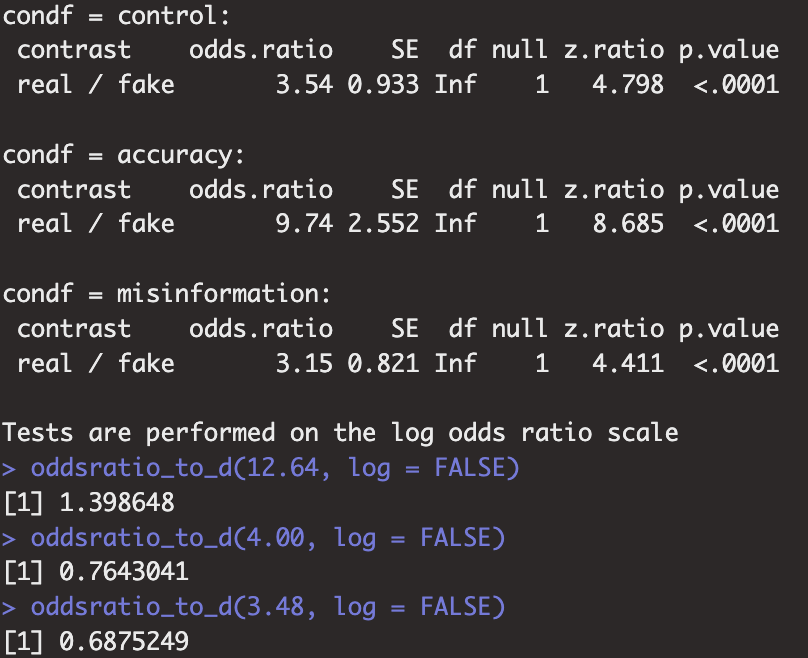
So, as far as we can tell, the odds ratios calculated in the first part of this output (3.54; 9.74; 3.15) should be the odds ratio values to convert, instead of the hard-coded values (12.64; 4.00; 3.48).
Minor error – example 2
The results for Study 4 state: “Also as expected, discernment was lower in the control and misinformation training conditions, although participants still shared more true headlines (control: 40%; misinformation: 54%)…”
From re-running the analysis code, it appears that the correct number for the control condition is 43%, not 40%. This is also apparent from examining the gray bar for the control condition in Figure 7: it is clearly above 40% (.40).
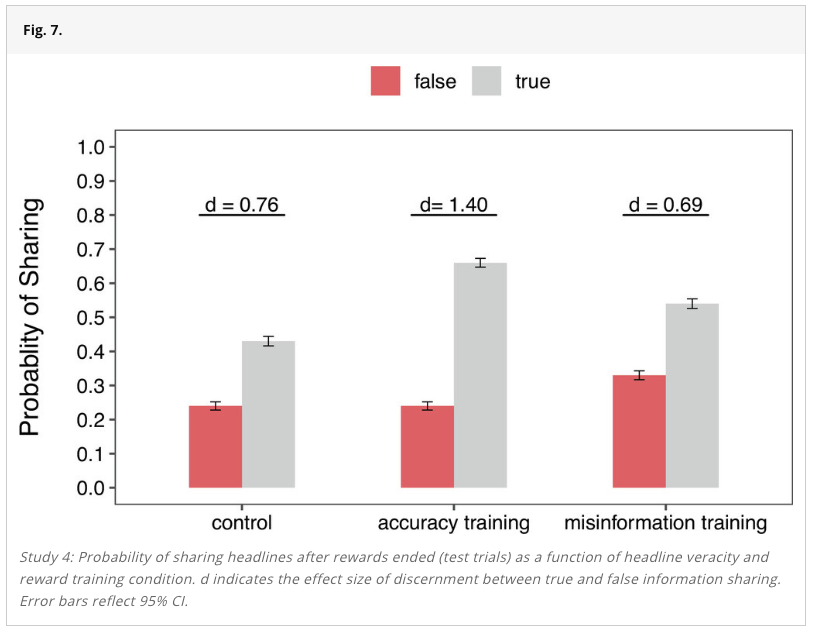
Minor error – example 3
The error bars in Figure 6 are stated to be 95% confidence intervals (see figure caption):
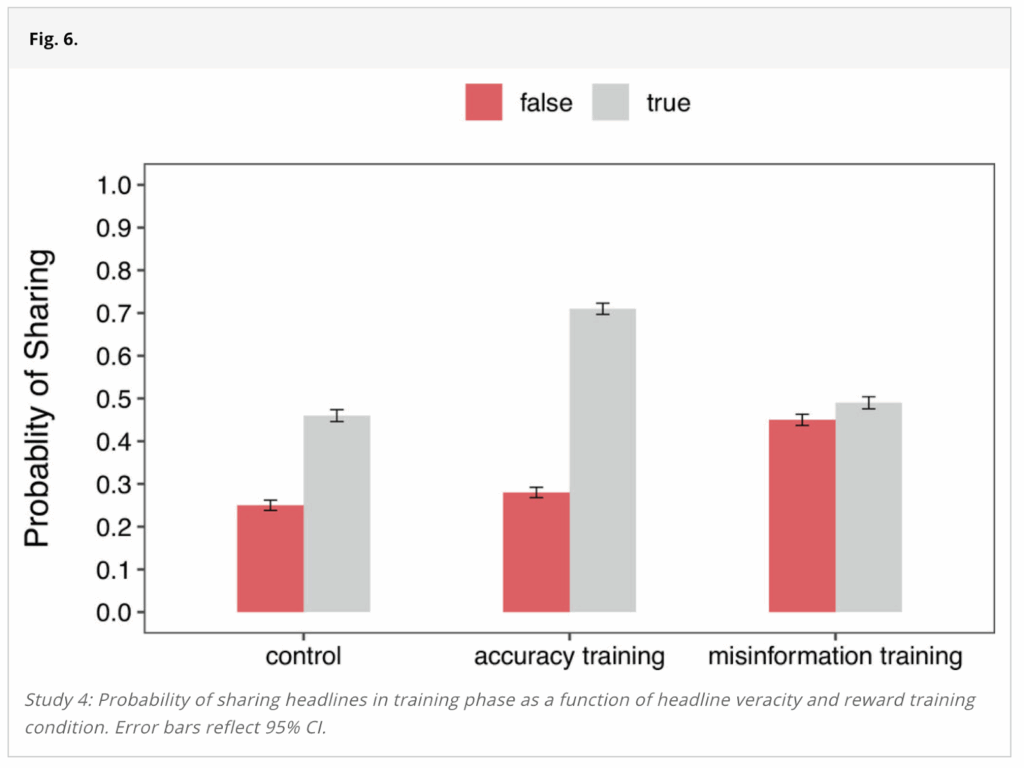
However, it is clear from the analysis script that the error bars represent standard errors instead (the highlighted line shows the error bars being calculated by adding and subtracting the standard error):
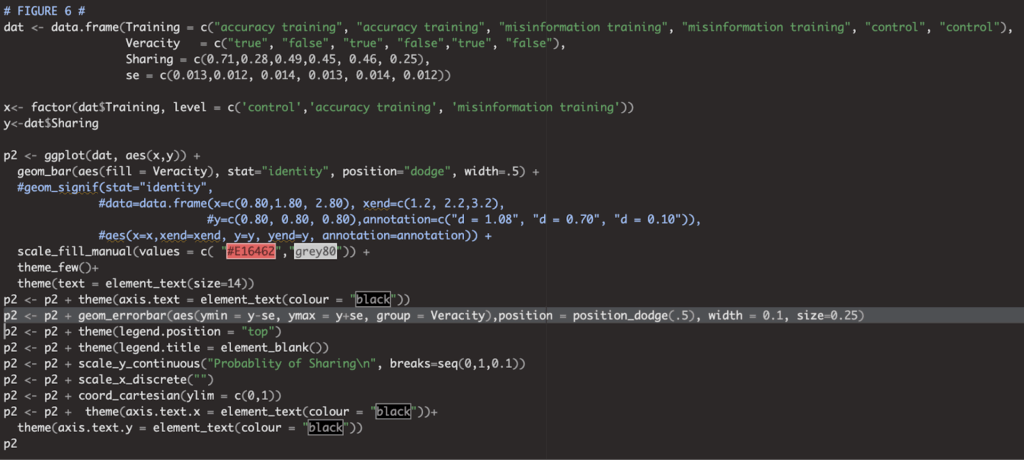
Minor errors – conclusion
Again, it is important to emphasize that these errors do not meaningfully change the interpretation of the results. But, they do represent reproducibility issues and some of these errors could, in theory, affect future meta-analyses that use the results reported in the paper.
References
Aczel, B., Palfi, B., Szollosi, A., Kovacs, M., Szaszi, B., Szecsi, P., … & Wagenmakers, E. J. (2018). Quantifying support for the null hypothesis in psychology: An empirical investigation. Advances in Methods and Practices in Psychological Science, 1(3), 357-366. https://doi.org/10.1177/2515245918773742
Chmielewski, M., & Kucker, S. C. (2020). An MTurk crisis? Shifts in data quality and the impact on study results. Social Psychological and Personality Science, 11(4), 464-473. https://doi.org/10.1177/1948550619875149
Cuskley, C., & Sulik, J. (2022). The burden for high-quality online data collection lies with researchers, not recruitment platforms. Perspectives on Psychological Science, 17456916241242734. https://doi.org/10.1177/17456916241242734
Faul, F., Erdfelder, E., Buchner, A., & Lang, A.G. (2009). Statistical power analyses using G*Power 3.1: Tests for correlation and regression analyses. Behavior Research Methods, 41, 1149-1160. https://doi.org/10.3758/BRM.41.4.1149
Seedorff, M., Oleson, J., & McMurray, B. (2019). Maybe maximal: Good enough mixed models optimize power while controlling Type I error. PsyArXiv. https://doi.org/10.31234/osf.io/xmhfr
Stagnaro, M. N., Druckman, J., Berinsky, A. J., Arechar, A. A., Willer, R., & Rand, D. (2024). Representativeness versus attentiveness: A comparison across nine online survey samples. PsyArXiv. https://doi.org/10.31234/osf.io/h9j2d
Webb, M. A., & Tangney, J. P. (2022). Too good to be true: Bots and bad data from Mechanical Turk. Perspectives on Psychological Science, 17456916221120027. https://doi.org/10.1177/17456916221120027
Westfall, J., Kenny, D. A., & Judd, C. M. (2014). Statistical power and optimal design in experiments in which samples of participants respond to samples of stimuli. Journal of Experimental Psychology: General, 143(5), 2020-2045. https://doi.org/10.1037/xge0000014
