
Updated: May 7, 2026
How has the replication rate of psychology studies changed in recent years?
Are we still experiencing a “replication crisis,” where only 40-60% of results replicate when the study is conducted again?
Psychology experts who we surveyed predicted that 55% of recently published studies published in top journals would replicate, suggesting that they think the field is still experiencing a serious replication crisis, although they also believe that substantial progress has been made, as we discussed in Part 1. Is their assessment accurate?
We completed our first dozen replication attempts on recent papers selected randomly1 from top journals, and what we found really surprised us! As we’ll explore in the rest of this article, while the research looked much better than we expected on one metric, results on another metric (that’s rarely discussed) are more discouraging.
Unlike other replication projects, which have focused on prominent older findings or have been limited to a single journal, our project focuses on recent papers, randomly selected from the top journals in the field. By selecting papers randomly and focusing on recent publications at the top of the field, we can use these replication results to reflect on the state of the field right now.
In addition to using a different selection process for papers, at Transparent Replications we don’t look at replicability in isolation. We rate studies on three criteria:
- The Transparency rating assesses the availability of study materials, data, and analysis code; as well as whether study was pre-registered and how well the pre-registration was followed.
- The Replicability rating reports how many of the main findings reported in the study replicated when we conducted the study again with new data.
- The Clarity rating evaluates how likely we believe a reader is to come away with an accurate impression of the study and results from reading the paper.
We rate studies on these three categories because replicability alone doesn’t tell the whole story of what makes papers useful and reliable.Transparency makes it possible to understand a result, and is often necessary for a faithful replication or reproduction. Clarity, which is a novel rating that we developed, allows us to assess factors that could be a problem even in papers that replicate – for example, overclaiming, validity issues, or other errors in the paper that would lead readers to misunderstand the implications of a result.
The table below shows the distribution of ratings on Transparency, Replicability, and Clarity for the first dozen reports that we conducted. Ratings under 4 stars are in bold. The ratings are on a scale of 0 to 5 stars.
| Report | Transparency | Replicability | Clarity |
|---|---|---|---|
| #1 | 5 | 4.25 | 3.5 |
| #2 | 4.25 | 4 | 3.5 |
| #3 | 4 | 2 | 5 |
| #4 | 4 | 5* | 3.75 |
| #5 | 3 | 5 | 1 |
| #6 | 3.75 | 4.5 | 3.5 |
| #7 | 5 | 5 | 4.5 |
| #8 | 3.5 | 5 | 2.5 |
| #9 | 4.25 | 5 | 3 |
| #10 | 4.25 | 5 | 5 |
| #11 | 4.5 | 0 | 2.5 |
| #12 | 3.75 | N/A | 0 |
| Average: | 4.1 | 4.1 | 3.1 |
We found our results on all three of these ratings to be somewhat unexpected, but the replication rate is especially at odds with psychology experts’ perceptions about the field.
Surprise 1: Replication rates are higher than experts predicted and p-hacking is much less common than we expected!
One of the most surprising things to us is how well the studies replicated. We’ve completed 12 reports (with a number of others currently in progress). In the replication studies that we conducted, 10 of them completely or mostly replicated, and only 2 had primary findings that mostly did not replicate.2 This is a rate of 83%, compared to the experts prediction of 55%. Of course 12 is a small number, so these should be considered preliminary findings until we have completed more replication reports.
The replicability rating score is the percent of study’s main findings that replicated, converted into a 0 to 5 star range. A study that received a rating of 4 had four-fifths (or 80%) of its main findings replicate, while a study with a rating of 2 only had two-fifths (or 40%) of its main findings replicate. Many studies only had one main finding, which means they could only receive a score of 5 (100%) if the finding replicated, or a score of 0 (0%) if the finding did not replicate.
Here’s a summary of the replicability scores:

In addition to the high replicability rate overall, it’s informative to look into the reasons why the 2 studies that largely failed to replicate didn’t replicate.
In one case we believe that the lack of replication was due to the statistical power issues.3 For that reason, we don’t take it as meaningful evidence that we should reduce our confidence in the original paper’s findings. That report was instructive for demonstrating how much impact subtle experimental design decisions can have on statistical power, especially in more complex statistical models.
In the other case of replication failure, we think the study’s main finding didn’t replicate because the original sample had a peculiar characteristic that the authors diagnosed and acknowledged, but that influenced the results in an unanticipated way. In this case we do think the lack of replication should reduce confidence that the claimed effect in the paper is real, but we don’t see any evidence of p-hacking in this paper. This finding not replicating demonstrates the value of replicating research findings even when no p-hacking is suspected – spurious results can occur even when researchers do their work carefully, and replication is how those results are detected.
That means that in our first 12 completed replications, we did not find a single case where we believe substantial p-hacking meaningfully impacted the results! (As a reminder, p-hacking is consciously or unconsciously taking advantage of choices available to researchers in data collection or data analysis to generate or selectively report results that meet the statistical significance threshold (e.g., p<0.05), when a result wouldn’t otherwise have been statistically significant.)
The lack of evidence of p-hacking is shocking when you compare it to large replication studies, like the Open Science Collaboration’s replication of 100 studies from the 2008 issues of three prominent journals, the replication of 21 papers published from 2000-2015 in Nature and Science, or the Many Labs project’s multiple replications of prominent findings that were originally reported from 1936 to 2014. In these replication projects, covering papers from ten or more years ago, roughly 40%-60% of papers failed to replicate, with many (and perhaps the vast majority) of those failures seemingly due to p-hacking.
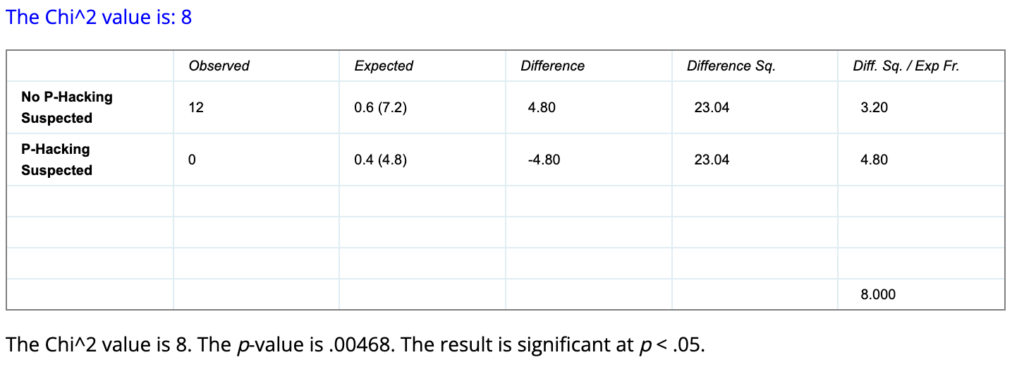
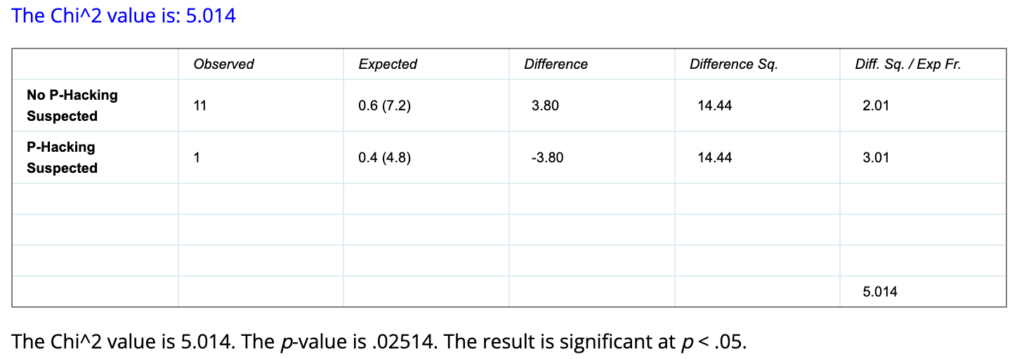
While 12 is obviously a small number (and we’ll have more data over time), if we assume that rates of substantial p-hacking for main findings is 40% – which we believe is a reasonable estimate of what they were 15 years ago based on data from large-scale replication studies, then there would only be about a half of a percent chance that we would find no cases of substantial p-hacking out of 12 replications conducted! Even if we are mistaken and 1 of the studies we replicated had substantial p-hacking influencing the finding, that would still indicate less than a 3% chance of having that few (or fewer) such cases out of 12 if the base rate was 40%! (Supporting calculations for this paragraph are in the Appendix.)
This suggests to us that p-hacking may now be substantially less common than it used to be. Increasing transparency, preregistration, and awareness of the problem may have influenced reviewer comments, and editor decisions. Additionally, as p-hacking has come to be considered less acceptable and the problems with it more widely understood, researchers may simply be holding themselves to a higher standard in their own research.
Surprise 2: Public availability of data and materials is widespread, yet deviations from pre-registration are commonly not acknowledged
In addition to higher than expected replication rates, we were pleasantly surprised by how strong transparency practices are in recent papers in top journals, although more work needs to be done to ensure that deviations from pre-registration are acknowledged in published papers.
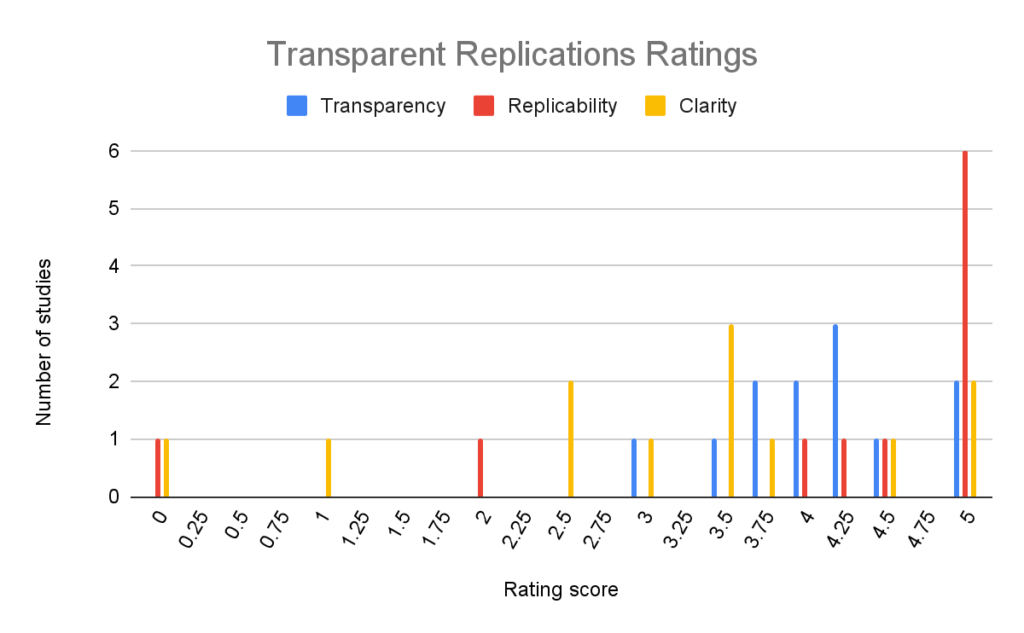
Looking at the chart below, you can see that the lowest transparency rating so far has been a 3 out of 5. The average transparency rating of our reports overall is 4.1. At least from this limited dataset, what this tells us is that, in top journals in the field, data, analysis code, and experimental materials are usually publicly shared. This may be due to top journals expecting that these materials are shared. Preregistration is fairly common, but far from universal.
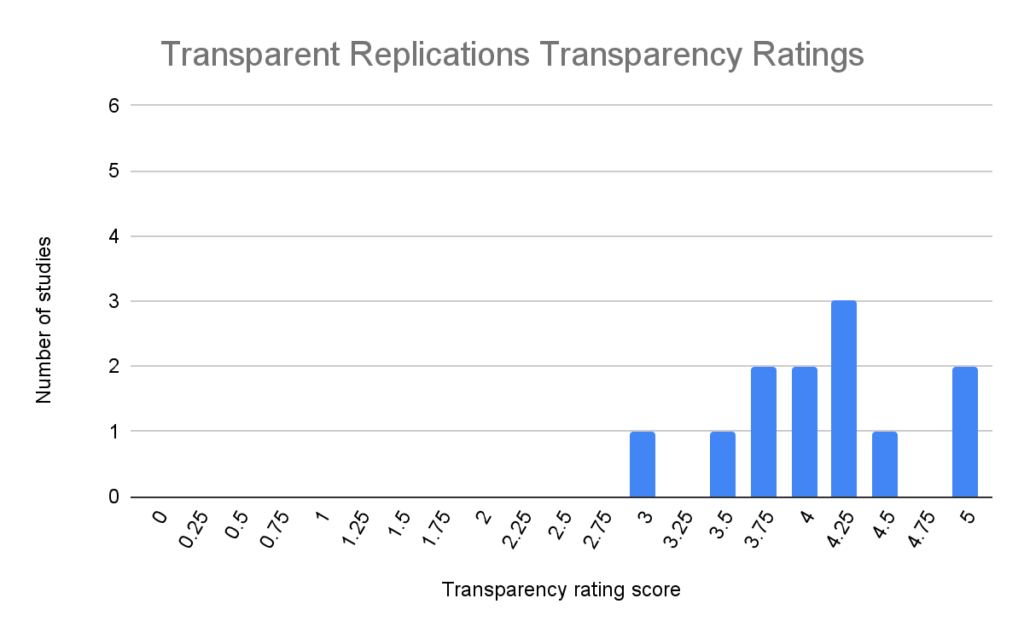
Our Transparency rating includes 4 sub-ratings. The first three assess the availability and completeness of study materials (1), analysis code (2), and data (3). The fourth is about pre-registration, including whether the study is pre-registered, how well the pre-registration is followed, and whether deviations from the pre-registration are acknowledged in the paper. In practice, a study receiving a 3 for Transparency may have study materials and data publicly available, but not have analysis code available, and have major undisclosed deviations from the preregistration. A study receiving a 4 likely has materials, data, and code that are available, but the study wasn’t pre-registered. A study receiving a 5 follows its pre-registration (or acknowledges and explains any deviations), and has study materials, analysis code, and data that are complete and publicly available. A full explanation of our Transparency rating system is available here.
This level of transparency is a serious improvement over past practices, and makes it much more possible for replication and reproduction of studies to be conducted. Open science norms about transparency appear to be much more widespread than they used to be.
The most serious transparency issue that we ran into is that a study may be pre-registered, but deviate from the pre-registered analysis plan without acknowledging the changes that were made. In the first dozen reports, seven of the studies were preregistered; however, of those seven studies, only two followed their preregistration without any unacknowledged deviations. One had minor deviations in exclusion criteria that weren’t disclosed, two more had moderate unacknowledged deviations from their preregistration, and two had major unacknowledged deviations.

Sometimes it is appropriate to deviate from a preregistration, but when that happens, the paper should acknowledge the changes and explain why they were made. Preregistration can only do its job of reducing researcher degrees of freedom and preventing questionable research practices like p-hacking and unreported instances of HARKing (Hypothesizing After the Results are Known) if the preregistration is followed.
When journals evaluate submitted papers, it should be standard practice to compare the preregistration to the paper to see if they are consistent, and if there are inconsistencies ensure that they are disclosed and explained. It’s excellent to see that Psychological Science has started doing exactly that with all published papers starting at the beginning of this year. We hope to see more journals implement that best practice.
Since top journals are starting to require submissions to meet many of these transparency benchmarks, we think it is likely that we’ll continue to see high transparency ratings for papers as we conduct more replications. Hopefully other journals will follow the lead of Psychological Science and check for deviations from pre-registration and include a report of those deviations with the published paper. That would go a long way to improving the main transparency issue that we found in our first twelve replication reports.
Surprise 3: Importance Hacking and/or errors affect most papers, and appear to be much bigger issues than p-hacking!
The rating area where we see the most need for improvement is Clarity. From looking at the chart you can see that Clarity ratings vary much more widely than Transparency ratings. The Clarity rating averaged over our first dozen reports was 3.1, an entire point lower than the averaged Transparency rating.
The clarity rating addresses how likely we believe a reader is to come away with an accurate impression of the study and results from reading the paper. Low clarity suggests that a reader may be likely to misunderstand key aspects of the research or its implications.
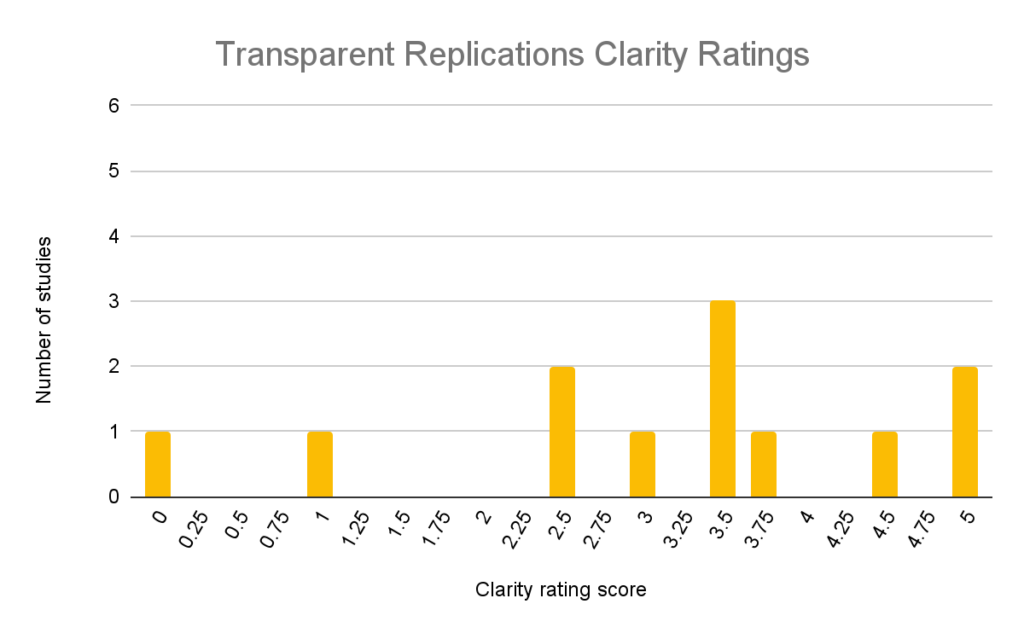
There are two main classes of issues that reduce the clarity of a paper. Only two of the twelve papers we evaluated had neither type of clarity issue.
Clarity Issue 1: Errors (and imprecision)
The first clarity issue we look for are errors or imprecision in the study materials, analyses, and paper. We also evaluate the severity of errors and impressions. For example, an error that is minor or that doesn’t impact the main takeaway of a study impacts the clarity rating much less than an error that changes the study’s takeaway, and much less than if the study involved a long list of small errors.
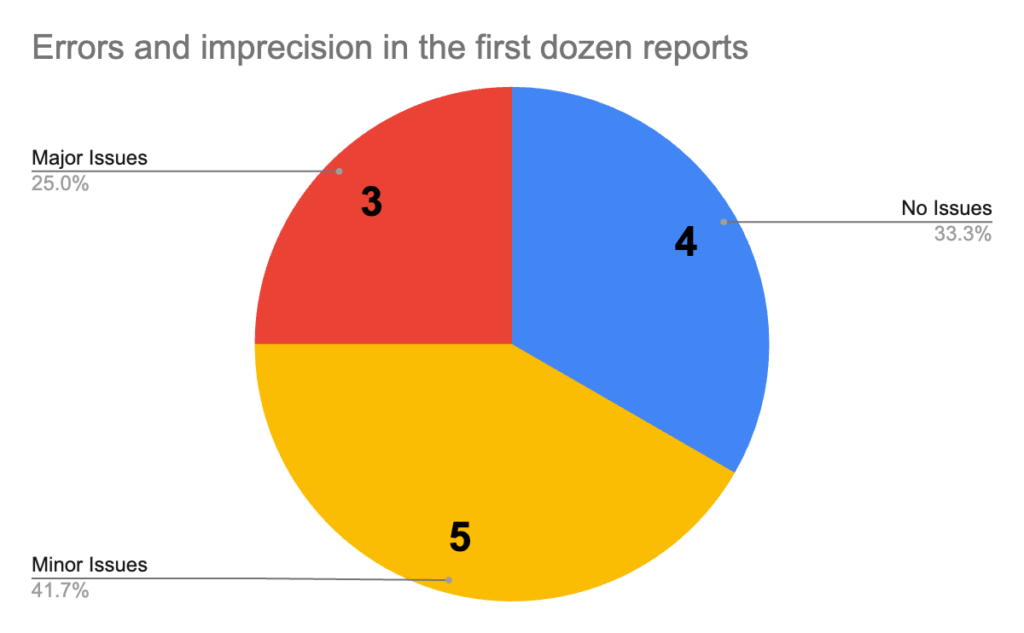
A total of eight of the twelve papers we evaluated had issues of this type, three of which we would consider to have major issues.
For example, across different studies that we investigated, we found composite variables that were miscalculated, incorrect statistical tests being used, and experimental materials which included mistakes in key questions.
We also evaluated studies where key features of the study that would be important to the reader understanding and interpreting the results were not clearly described in the paper. We found five papers with minor issues in communicating information the reader would need to understand the study and results. These issues included inaccuracies in descriptions of study procedures, incorrect numbers in results tables, and omissions of important information about key variables.
We consider these issues of error and imprecision together because the distinction can be difficult to make in practice. For example, if a variable is calculated differently in an analysis than how it seems to be described in the paper, it’s possible that the calculation was done that way incorrectly (in error), or that the explanation in the paper is an unclear (or imprecise) description of what was done. Ultimately, whether such an occurrence is an error (they did a calculation that was different than they intended) or an example of imprecision (they did what they intended but misexplained it to the reader) comes down to the intention of the researchers, which usually can’t be evaluated from the paper and its materials.
We were surprised by the amount of error that we encountered in published papers (which, recall, were all published in top peer-reviewed journals). This suggests that improvements need to be made to editorial processes so that these issues are detected and addressed prior to publication.
Along these lines we are pleased to see that, in addition to reporting on deviations from preregistration, Psychological Science has started reproducing statistical results prior to publication for many of their papers. While some of the errors that we encountered would have required a more in-depth investigation to detect, we suspect that at least two of the three cases of serious errors we found would have been detected had they been subjected to this review process.
If other journals implement more rigorous pre-publication checks, that would go a long way to addressing the more severe cases of this issue. If the analysis code doesn’t run properly, the analysis has issues (like the model failing to converge), the paper mislabels the statistical tests used, or there are discrepancies in the reported results, this kind of check would have a good chance of detecting it.
Clarity Issue 2: Importance Hacking
The second issue that reduces the clarity of a paper is what we call, “Importance Hacking.” Oddly, we do not believe this concept had a standard name before we gave it one, despite it being commonplace. We think it’s critical to have a name for this phenomenon, because we believe it is not only common, but important to address for making further improvements in how science is practiced.
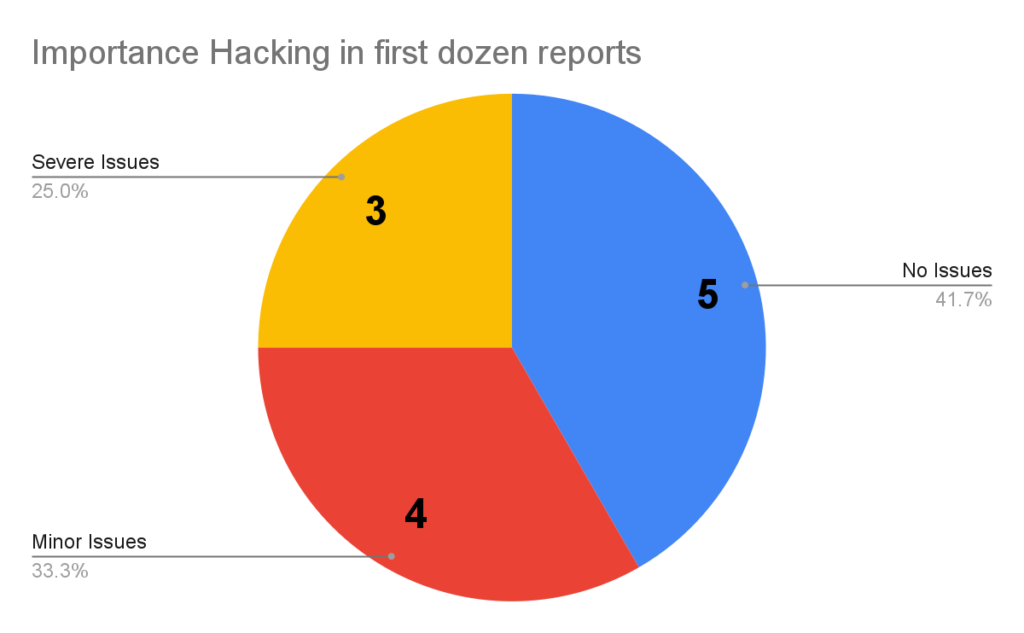
Seven of the twelve studies had at least a minor Importance Hacking issue in our analysis, three of which were more severe.
Importance Hacking occurs when real, replicable findings are made to appear more valuable or worthy of publication than they really are. In some cases, Importance Hacking pushes a paper across the threshold from unpublishable to publishable by convincing journal editors and reviewers that a paper merited publication when, in fact, it didn’t. We refer to those as “Importance-Hacked acceptances.”
Importance Hacking can include a variety of problematic research practices such as overclaiming, hype, lack of generalizability, claims that don’t actually follow from the statistical results, and/or tiny effect sizes that lack real world significance. For more about the types of Importance Hacking see Spencer Greenberg’s Clearer Thinking article.
We found lack of generalizability and insufficient engagement with plausible alternative explanations were the most common Importance Hacking issues in the first dozen papers. In addition to those more common issues, we found a study that used a complex analysis implying a result that wasn’t supported if a simple (but still valid) analysis was done. Another study made central claims that did not match the evidence provided.
Although there have been some calls for attention to issues of generalizability, ecological validity of experiments, and small effect sizes; addressing Importance Hacking hasn’t yet gotten the attention that tackling p-hacking and other questionable research practices has received. Our preliminary findings suggest this is the next major frontier for improving research.
To tackle Importance Hacking we need to change norms and develop new techniques. For example, requiring papers to include the Simplest Valid Analysis addresses some types of Importance Hacking as well as p-hacking. Studies being presented in a consistent way using a Study Diagram may address another kind of Importance Hacking by making the critical aspects of a study clearer at a glance, which makes overgeneralizing and making unjustified claims more difficult to do without it being noticed.
Conclusions
This chart combines the Transparency, Replicability, and Clarity ratings charts from above, showing the number of studies with each rating on each of the three criteria.
Our overall take on these first dozen reports is that there is a lot of reason for optimism about psychology as a field, and yet major hurdles remain.
The Replication rate in these randomly-selected recent papers from top journals (83%) appears to be substantially higher than in papers from fifteen or more years ago (40-60%), and substantially higher than what the experts we surveyed predicted (55%). Although this is a small sample of papers, the fact that they were selected through a randomized process and that we didn’t find a single clear-cut instance of p-hacking means we can take this as preliminary evidence suggesting meaningful improvement.
The widespread adoption of transparency practices for papers in top journals is another reason for optimism. Additionally, at least one journal, Psychological Science, is addressing unacknowledged deviations from the study’s preregistration. By checking for deviations from the preregistration, reporting whether any were found at the end of the paper, and including a table in the supplemental materials listing them, Psychological Science is likely to be able to largely prevent the most serious issue we found in transparency – a paper claiming that a study is preregistered, but our review revealing substantial undisclosed discrepancies between the paper and preregistration. Sometimes deviations from the preregistration are done for good reason, but they should always be disclosed, and this approach ensures that.
As Replicability and Transparency seem to have improved, there is more need to focus on the Clarity issues that continue to plague published research. Addressing the error portion of Clarity should be relatively straightforward – making it standard practice for journals to check results prior to publication, as Psychological Science does, would take a big step towards solving this problem.
We believe the next frontier in improving psychology research is tackling Importance Hacking, which will require changing norms and developing techniques to tackle problems with validity, generalizability, overclaiming, small effect sizes, and other ways that a study can be made to seem more valuable than it truly is.
The problem of Importance Hacking also struck the experts we surveyed as a serious issue meriting greater attention from the field. We will address what psychology experts think about the severity of the problem of Importance Hacking compared to the problem of p-hacking in the field today in Part 3 of this series.
This article is the second in a four-part series. For more of what we learned, check out Part 1 on the Replication Crisis, Part 3 on Importance Hacking and p-hacking, and Part 4 on the “Simplest Valid Analysis”.
Note: This article was updated on May 7, 2026 to reflect a more refined definition of Importance Hacking.
Appendix
Chi-Squared Goodness of Fit Test Results for P-Hacking Estimates
For 0 suspected p-hacking instances out of 12 observations, when the expected rate is 40%, the p-value of the Chi-Squared Test of Goodness of Fit is .00468, or a 0.468% chance of achieving a result that extreme or more extreme by chance if the true rate of p-hacking is 40%.
If we missed one that we should have suspected, and there was 1 suspected p-hacking instance out of 12 observations, the p-value of the Chi-Squared Goodness of Fit test is .02514, or a 2.514% chance of achieving a result that extreme or more extreme by chance if the true rate of p-hacking is 40%.
Calculations completed using the Social Science Statistics Chi-Square Goodness of Fit calculator.
Psychological Science Transparency and Reproducibility Policy Changes
See Simine Vazire’s editorial “The Next Chapter at Psychological Science,” and Tom Hardwicke and Simine Vazire’s editorial “Transparency is Now the Default at Psychological Science,” for more information about the changes to their transparency and reproducibility policies.
Additional information about Psychological Science’s STAR editors’ responsibilities from their Contributor FAQ:
STAR (Statistics, Transparency, & Rigor)editors are not handling editors – they do not make decisions on submitted manuscripts. STAR editors do a few other things:
- Ad hoc advice. STAR editors provide advice to handling editors on a case-by-case basis, typically during Tier 1 and Tier 2 review. This advice could be about statistics, methods, ethics, integrity, equity/inclusion, and transparency, and typically supplements or fills in gaps not covered by the handling editors’ and external reviewers’ expertise.
- Transparency checks. STAR editors conduct routine transparency checks at two stages of review.
- Light transparency checks (during Tier 2 review). When a handling editor decides to send a manuscript out for external review, a STAR editor is also assigned to do a light transparency check. This includes checking that the Research Transparency Statement is complete, that links to data, analysis scripts, materials, and preregistrations point to relevant-looking documents, and a quick skim of the manuscript to confirm that the level of transparency is accurately represented. The STAR Editor will return a report to the handling editor, flagging any issues or concerns, and any requests from authors for exemptions from transparency requirements. The handling editor will consult with the STAR Editor as needed, and factor this information into their decision.
- In-depth transparency checks (during Tier 3 review). When a handling editor is ready to conditionally accept a manuscript, a STAR editor is tasked with completing an in-depth transparency check. This includes a more thorough check of the data, analysis scripts, materials, and preregistrations, driven by the principles of findability, accessibility, interoperability, and reusability (see FAIR principles). How in-depth these checks are will depend on the capacity of the STAR Editor team. The waiting time at Tier 3 review can be markedly reduced by authors following best practices for making their data, analysis scripts, materials, and preregistrations easy for others to understand and use, and providing thorough documentation and meta-data (e.g., a codebook or read-me file explaining how the dataset is structured, what the variables and their levels are, etc.).
If authors have applied for a Computational Reproducibility Badge, the STAR Editor will spend about one hour attempting to computationally reproduce the main findings in the manuscript. After that, the STAR Editor may work with the author if they feel that computational reproducibility would be achievable with little more effort.
STAR Editors may also conduct random checks of computational reproducibility even for submissions where the authors did not apply for a computational reproducibility badge. Our goal is to work towards being able to conduct computational reproducibility checks for all conditionally accepted manuscripts.
- For more on this see “What We Do” on our website, which explains our selection process and the constraints on which papers we consider eligible, which take into account ethical, logistical, and cost considerations. ↩︎
- Note that the chart contains one report (#12) for which we did not attempt a replication due to methodological issues with the original study. The chart also contains one report (#4) for which we selected 2 studies, both of which replicated. That is why we report 10 out of 12 studies mostly replicating, despite the chart only showing replication ratings for 11 of the 12 reports. ↩︎
- See the replication report for details. ↩︎
