Executive Summary
| Transparency | Replicability | Clarity |
|---|---|---|
 | 10 of 12 findings replicated | |
We ran a replication of study 2 from this paper, which assessed three sets of beliefs (each measured by averaging responses to three self-report questions) about what causes variation in financial well-being. The original authors predicted that people’s agreement with a given set of beliefs would be more positively associated with support for government goals that are compatible with those beliefs than with support for the other government goals in the study. The original authors’ findings were mostly consistent with their predictions, and 10 of their 12 findings replicated in our study. However, some readers might misinterpret some of the paper’s conclusions (the correlations between each of the three sets of beliefs and support for each of the three government goals differ from what a reader might expect).
Full Report
Study Diagram
Replication Conducted
We ran a replication of Study 2 from: Krijnen, J. M. T., Ülkümen, G. Bogard, J. & Fox, C. (2022). Lay Theories of Financial Well-Being Predict Political and Policy Message Preferences. Journal of Personality and Social Psychology, 122(2), 310-336. https://doi.org/10.1037/pspp0000392
How to cite this replication report: Transparent Replications by Clearer Thinking. (2022). Report #1: Replication of a study from “Lay Theories of Financial Well-being Predict Political and Policy Message Preferences” (JPSP | Krijnen et al. 2022). https://replications.clearerthinking.org/replication-2022jpsp122-2
(Preprint DOI: https://doi.org/10.31234/osf.io/4psw3)
Key links
- Read our preregistration
- Download a .csv file of our de-identified raw data
- View the GuidedTrack code for the experiment (free login required to access)
- Preview the experiment
- Download our analysis scripts and files:
- Preprocessing script (adapted directly from original team’s script)
- Analysis script (adapted directly from original team’s script)
- Additional analyses in R
- Additional analyses in Jasp – on original and replication dataset
- See the Manifold Markets prediction market for this study – which predicted that we would replicate 4.2 of the 12 findings
- Download a PDF of the original study
- View the supplemental materials for the original study at OSF
Overall Ratings
To what degree was the original study transparent, replicable, and clear?
| Transparency: how transparent was the original study? | This study had perfect ratings on all Transparency Ratings criteria. |
| Replicability: to what extent were we able to replicate the findings of the original study? | Ten of the original study’s 12 findings replicated (83%). |
| Clarity: how unlikely is it that the study will be misinterpreted? | The methods are explained clearly, but the text-based descriptions of Study 2 could allow readers to come away with a misinterpretation of what the findings actually showed. |
Detailed Transparency Ratings
| Overall Transparency Rating: | |
|---|---|
| 1. Methods Transparency: | Publicly-accessible materials described the administration of the study in enough detail for us to be able to replicate the original study accurately. The scales used were publicly available and were easy to find within the original paper. |
| 2. Analysis Transparency: | The authors were very transparent about the analysis methods they used. |
| 3. Data availability: | All data were publicly available and were easy to find on the OSF project site. |
| 4. Preregistration: | The authors pre-registered the study and conducted the study according to their pre-registered plan. |
Study Summary and Results
Study Summary
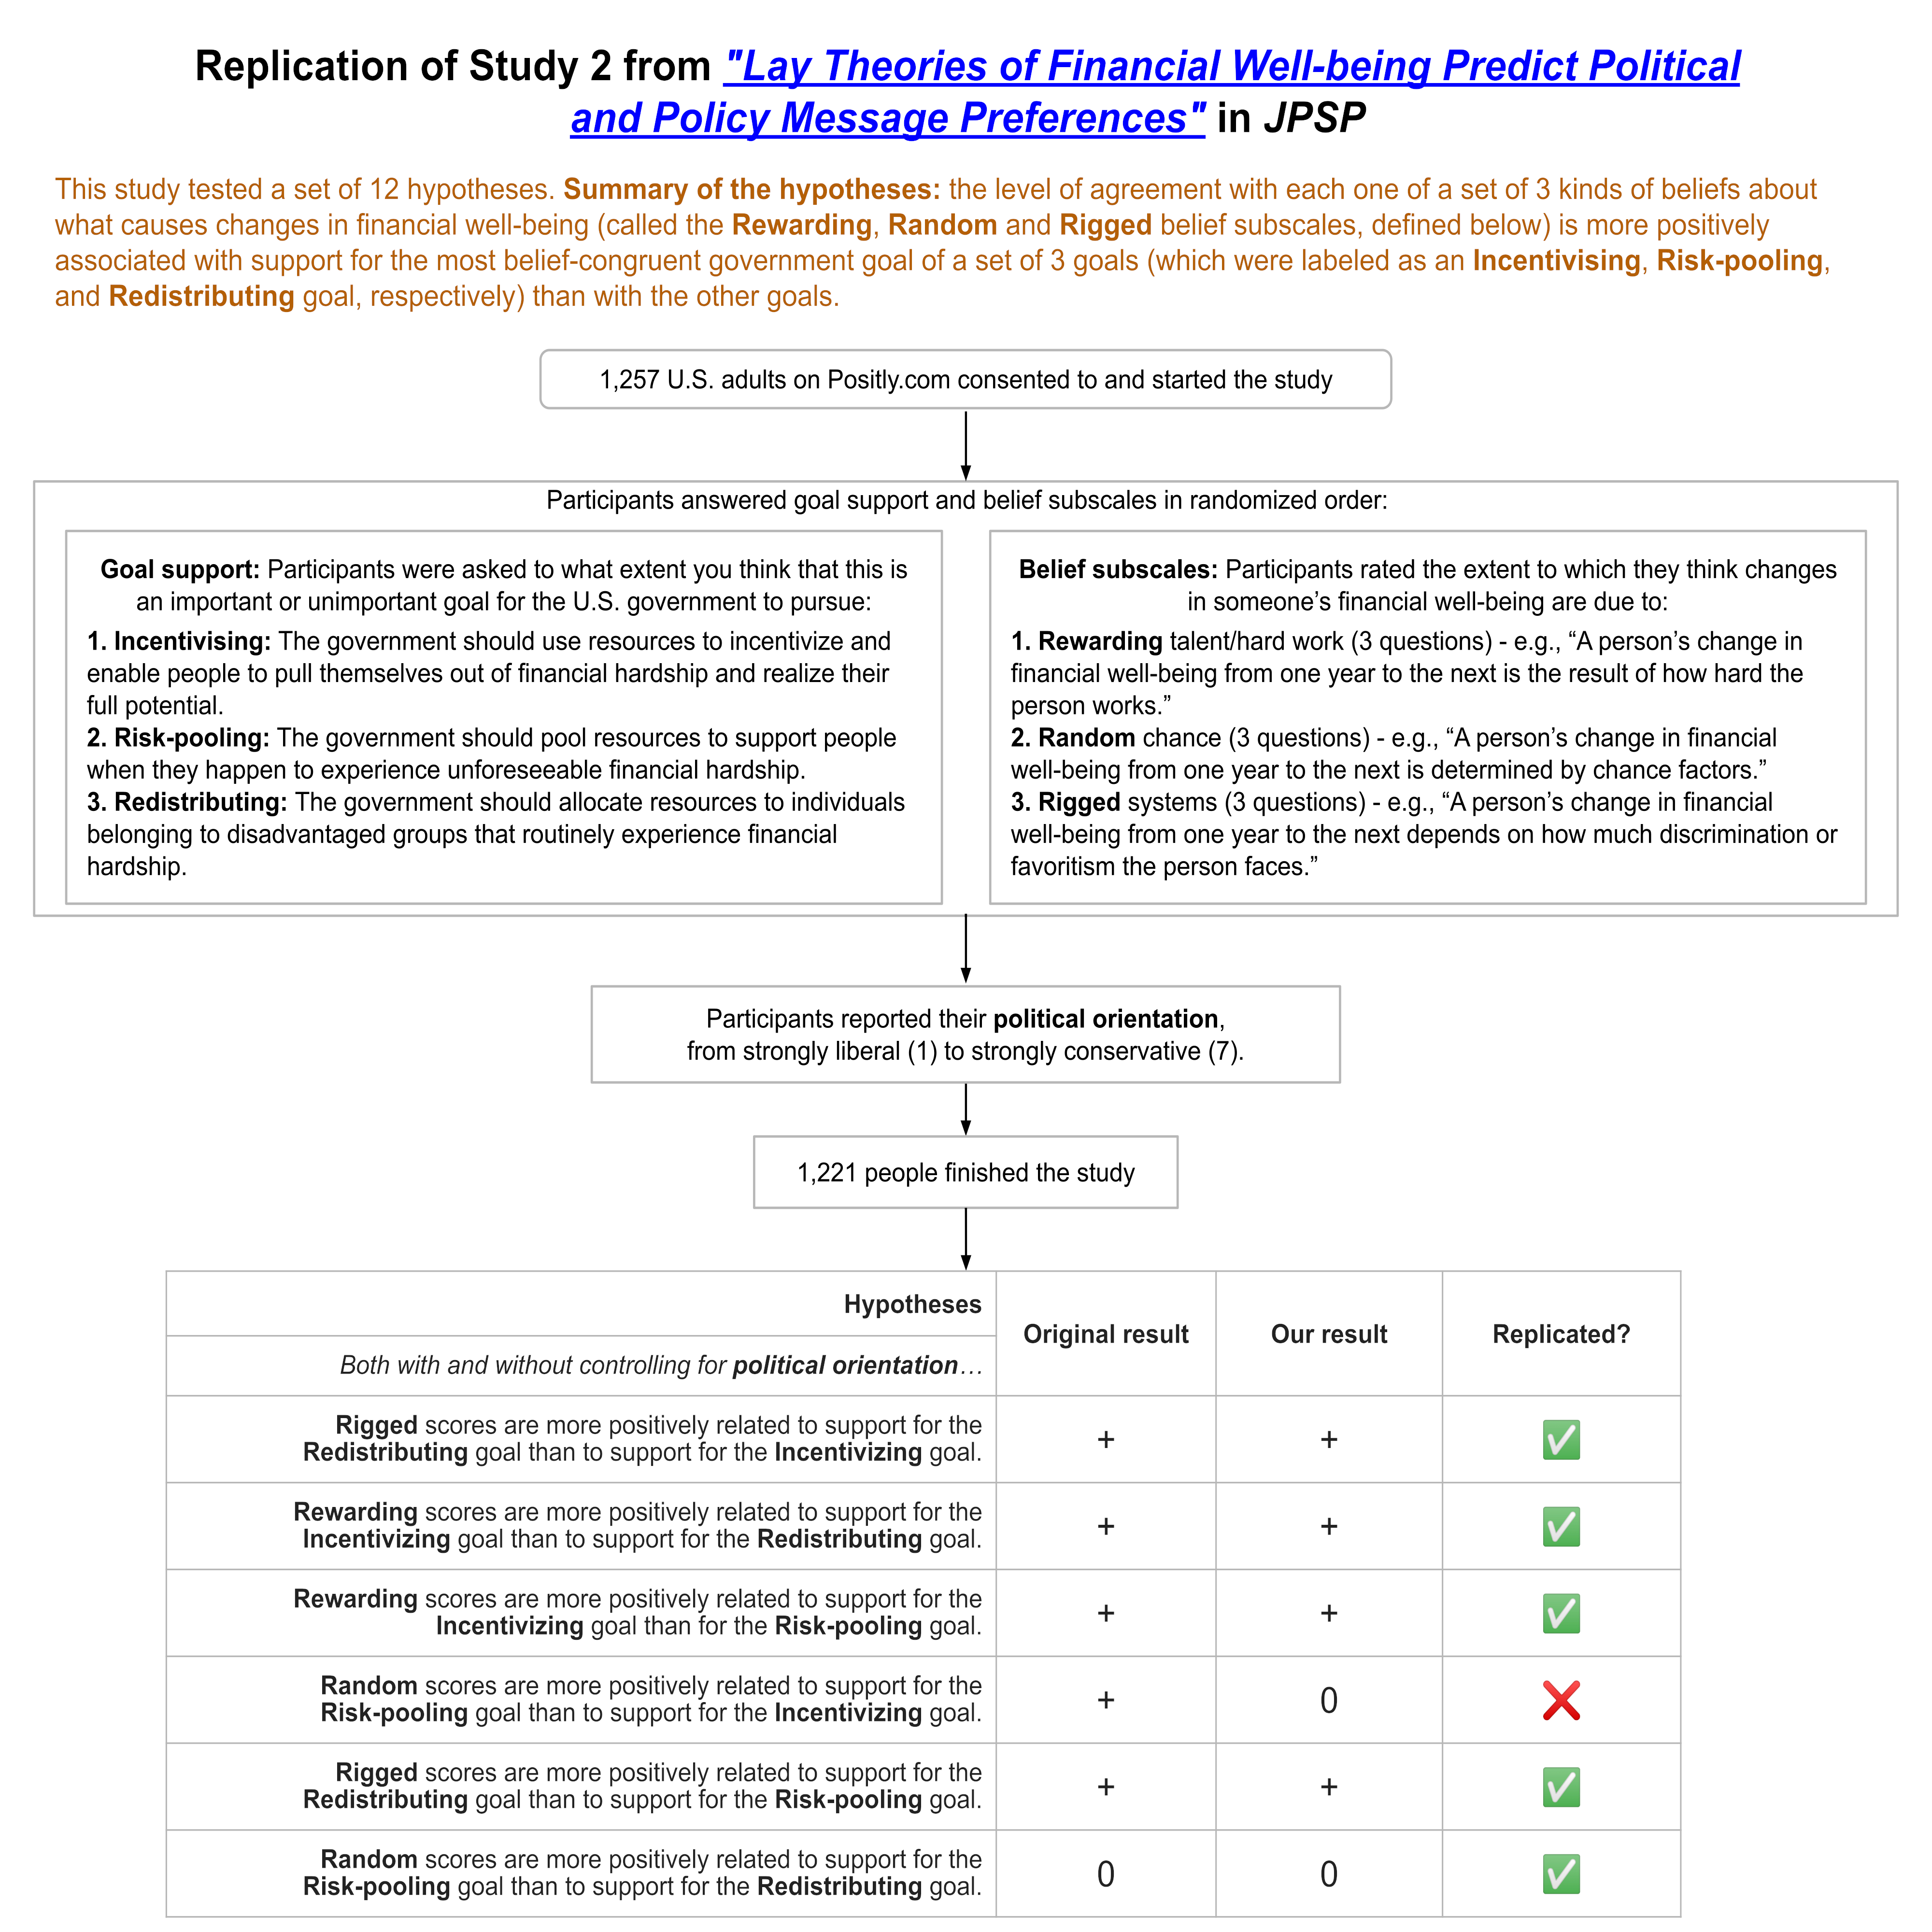
In Study 2 of this paper, researchers assessed three sets of beliefs (each measured by averaging responses to three self-report questions) about what causes changes in an individual’s financial well-being from one year to the next. They found that people’s agreement with a given set of beliefs is more positively associated with support for government goals that are compatible with those beliefs than with support for the other government goals in the study.
To measure views on what causes changes in an individual’s financial well-being, the researchers asked 1,227 participants to rate how true each of the following statements was (on a 7-point scale from “not at all” to “very much”):
| “Rewarding:” Agreement levels with these statements were averaged to get the “Rewarding” subscale | A person’s change in financial well-being from one year to the next… • is the result of how hard the person works. • tends to improve with the person’s resourcefulness and problem-solving ability. • is predictable if you know the person’s skills and talents. |
| “Random:” Agreement levels with these statements were averaged to get the “Random” subscale | A person’s change in financial well-being from one year to the next… • is something that has an element of randomness. • is determined by inherently unpredictable life events (e.g., getting robbed or winning the lottery). • is determined by chance factors |
| “Rigged:” Agreement levels with these statements were averaged to get the “Rigged” subscale | A person’s change in financial well-being from one year to the next… • depends on how much discrimination or favoritism the person faces. • is predictable because some groups will always be favored over others. • depends on the person’s initial status and wealth (i.e., rich tend to get richer and poor tend to get poorer). |
To measure support for government goals, the researchers asked participants to indicate “to what extent you think that this is an important or unimportant goal for the U.S. government to pursue” for three different government goals, and rated each on a 7-point scale ranging from “Not important at all” to “Extremely important.” The goals they rated were:
| Incentivizing: | “The government should use resources to incentivize and enable people to pull themselves out of financial hardship and realize their full potential.” |
| Risk-pooling: | “The government should pool resources to support people when they happen to experience unforeseeable financial hardship.” |
| Redistributing: | “The government should allocate resources to individuals belonging to disadvantaged groups that routinely experience financial hardship.” |
Participants were also asked to rate how liberal or conservative they were (on a seven-point scale from “strongly liberal,” 1, to “strongly conservative,” 7).
In the original study, there were also some other questions following the ones described above, but those were not used to create the main results table from the study (which is labeled “Table 10” in the original paper).
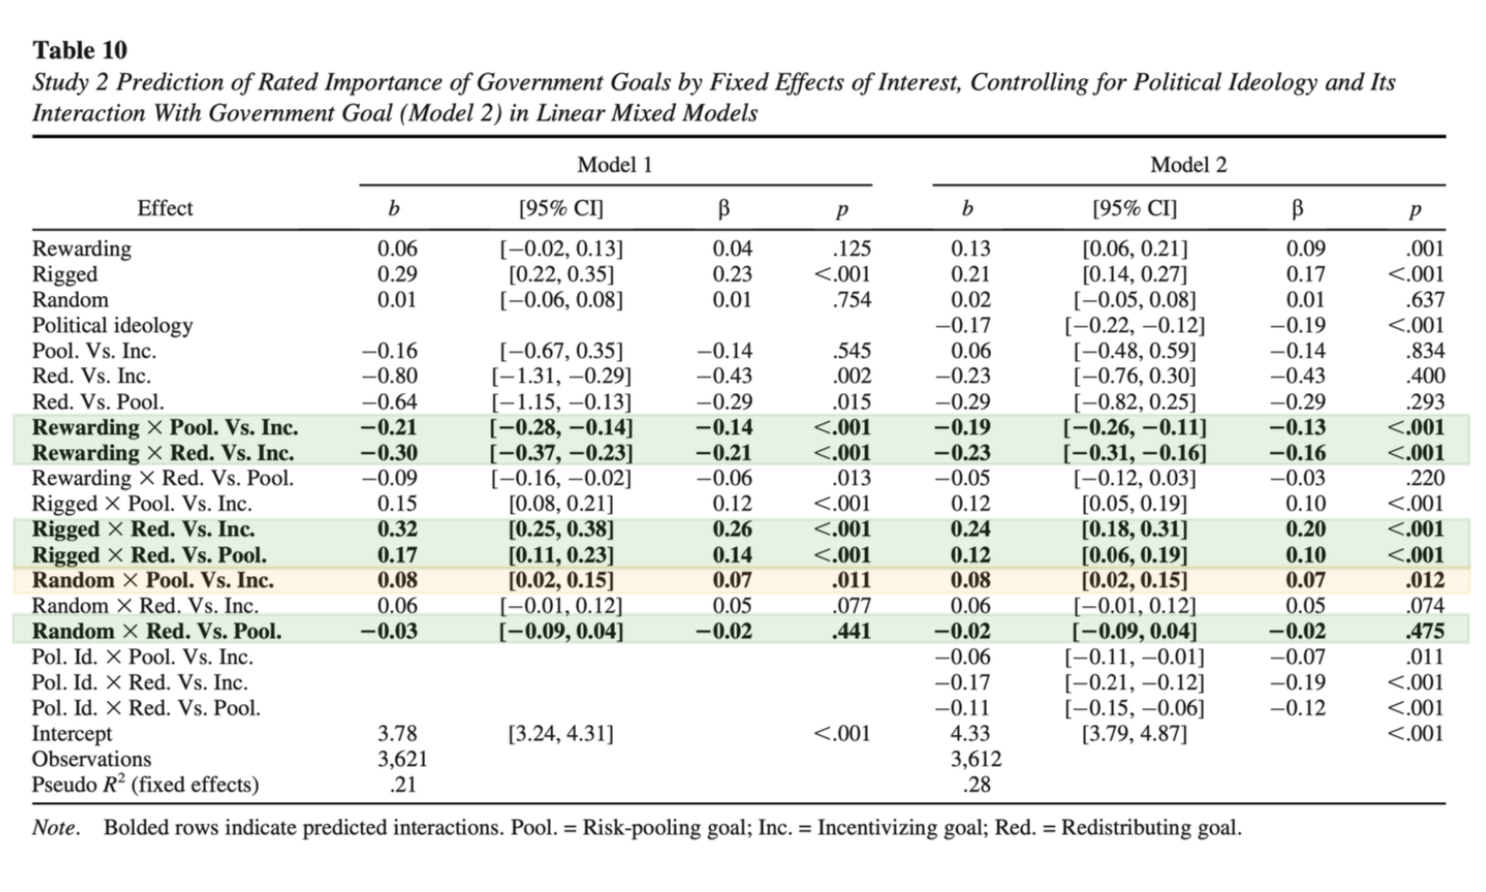
To produce the main results table for Study 2 in the original paper, the researchers first created a version of the dataset where each participant’s rating of support for each of the three government goals was treated as a separate observation (i.e., there were three rows of data per participant). This is known as “long data.” They then ran two linear mixed-effects models predicting goal support ratings (they ran two models in order to cover different reference levels for goals – one model had support for one goal as the reference level, and the other had another goal as the reference level) with participants as random effects (meaning that the relationships between the independent variables and goal support was allowed to differ between different participants).
The fixed effects independent variables included in the first pair of models were as follows: the scores on the three belief subscales, the type of government goal being considered (both of the non-reference-level goals were individually compared to the goal that was set as the reference level), and nine different interaction terms (one for each possible pairing of a subscale with a goal support rating). Finally, the researchers also ran a second pair of linear mixed-effects models with exactly the same variables as outlined above, but this time also including conservatism plus three interaction terms (between conservatism and each of the government goals) as independent variables in the model; this pair of models allowed them to assess the set of hypotheses while controlling for conservatism.
Our replication
We aimed to see if we could reproduce our own version of the original paper’s results table, so we asked the same sets of questions as those described above (N = 1,221 recruited using the Positly platform), and undertook the same analyses as those described above. Many thanks to the original study team for reviewing our replication materials prior to the study being run.
To experience our replication study as study participants saw it, click here. Note that half the people answered the CAFU items first, and the other half answered it second; and within each scale, the order of the questions was randomized. The question order you see will change across multiple repetitions of the preview.
Results Summary
There were six main hypotheses (labeled Ha through to Hf) being tested in the main results table for Study 2 (which we were replicating), each of which was tested twice – once controlling for conservatism (labeled H1a-f) and once without controlling for conservatism (labeled H2a-f). Across the six pairs of results, five hypotheses had been supported and one had not been supported in the original study. We replicated those findings, with one exception: Hypothesis “d” (both H1d and H2d) was supported in the original study but was not supported in our replication (though it did show a trend toward an effect in the same direction: for H1d, p=0.16, and for H2d, p=0.20).
Overall, we confirmed that – in most cases – people’s agreement with a given set of beliefs is more positively associated with support for government goals that are compatible with those beliefs than with support for the other government goals in the study. However, we also caution against misinterpreting these results – and explain exactly what these results do not imply – in a later section of this write-up.
Detailed Results
We aimed to replicate the main results table from Study 2 of the original paper (labeled as Table 10 in the original paper), which showed that, regardless of people’s self-reported levels of political conservatism:
- ✅ Higher scores on the Rewarding financial belief subscale were more positively associated with support for the Incentivizing goal than with support for the Risk-pooling or the “Redistributing” goals.
- ❌ Higher scores on the Random financial belief subscale were more positively associated with support for the “Risk-pooling” goal than with support for the Incentivizing goal.
- ✅ However, higher scores on the Random financial belief subscale were not more positively associated with support for the “Risk-pooling” goal than with support for the “Redistributing” goal.
- ✅ Higher scores on the Rigged financial belief subscale were more positively associated with support for the “Redistributing” goal than with support for the Risk-pooling or the Incentivizing goals.
Of the results listed above, the only conclusion that didn’t replicate is the one shown italicized above (preceded by the ❌ ). In our study, higher scores on the Random financial belief subscale were not more positively associated with support for the “Risk-pooling” goal than with support for the Incentivizing goal. All the other findings listed above replicated in our study. This applied to both the findings with and without controlling for conservatism.
Tabular View of Detailed Results
| Hypotheses and their levels of support | In brief: In the original study, H1a-e were supported and H1f was not. In our replication, H1a-c and H1e were supported; H1d and H1f were not. |
|---|---|
| How the hypotheses were tested: | These hypotheses were tested via a series of linear mixed-effects models, each of which had government goal support as the dependent variable (DV), and each of which allowed for random intercepts for each goal at the subject level. Each hypothesis was represented as a separate interaction term in the model (the interaction between between a given subscale score and the goal being a particular type in comparison to another type of goal); if the interaction term was significant, then the hypothesis was supported, whereas if it was not significant, the hypothesis was not supported. |
| H1a: | The effect of “Rigged” scores on support is more positive for the “Redistributing” goal than for the “Incentivizing” goal. |
| Result: | ✅ Supported in original study. Replicated in ours. |
| H2a: | H1a also holds when controlling for conservatism. |
| Result: | ✅ Supported in original study. Replicated in ours. |
| H1b: | The effect of “Rewarding” scores on support is more positive for the “Incentivizing” goal than for the “Redistributing” goal. |
| Result: | ✅ Supported in original study. Replicated in ours. |
| H2b: | H1b also holds when controlling for conservatism. |
| Result: | ✅ Supported in original study. Replicated in ours. |
| H1c: | The effect of “Rewarding” scores on support is more positive for the “Incentivizing” goal than for the “Risk-pooling” goal. |
| Result: | ✅ Supported in original study. Replicated in ours. |
| H2c: | H1c also holds when controlling for conservatism. |
| Result: | ✅ Supported in original study. Replicated in ours. |
| H1d: | An interaction between “Random” scores and the goal being risk-pooling whereby the effect of “Random” scores on support is more positive for the “Risk-pooling” goal than for the “Incentivizing” goal. |
| Result: | ❌ Supported in original study. Effect was in the ✅ same direction but was non-significant in ours (p=0.16). |
| H2d: | H1d also holds when controlling for conservatism. |
| Result: | ❌ Supported in original study. Effect was in the ✅ same direction but was non-significant in ours (p=0.20). |
| H1e: | An interaction between “Rigged” scores and the goal being redistribution whereby the effect of “Rigged” scores on support is more positive for the “Redistributing” goal than for the “Risk-pooling” goal. |
| Result: | ✅ Supported in original study. Replicated in ours. |
| H2e: | H1e also holds when controlling for conservatism. |
| Result: | ✅ Supported in original study. Replicated in ours. |
| H1f: | The effect of “Random” scores is more positive for the “Risk-pooling” goal than for the “Redistributing” goal. (We expected that H1f would *not* be supported, as it was not supported in the original study.) |
| Result: | ✅ Not supported in original study. This lack of support was replicated in ours. |
| H2f: | H1f also holds when controlling for conservatism. |
| Result: | ✅ Not supported in original study. This lack of support was replicated in ours. |
Summary of additional analyses
As planned in our preregistration document, we also checked the correlations between each of the scales and the subjective importance ratings of each scale’s most compatible goal (both with and without controlling for conservatism). Although these analyses were not done in the original paper, we chose them to see if they shed light on the original findings. They are much simpler than the original statistical analysis, but also give extra information about the relevant variables.
Correlations between each subscale and different goal types using our replication data (not controlling for conservatism) – 95% confidence intervals are shown in parentheses.
| Beliefs subscale | “Incentivizing” goal support | “Risk-pooling” goal support | “Redistributing” goal support |
|---|---|---|---|
| Rewarding | -0.03 (-0.08 to 0.03) p = 0.3664 | -0.23 (-0.29 to -0.18) p < 0.0001 | -0.28 (-0.33 to -0.23) p < 0.0001 |
| Random | 0.16 (0.11 to 0.22) p < 0.0001 | 0.30 (0.25 to 0.35) p < 0.0001 | 0.31 (0.26 to 0.36) p < 0.0001 |
| Rigged | 0.29 (0.24 to 0.34) p < 0.0001 | 0.48 (0.43 to 0.52) p < 0.0001 | 0.55 (0.52 to 0.59) p < 0.0001 |
Partial correlations between each subscale vs. different goal types using our replication data (all correlations in this table are partial correlations controlling for conservatism; all are statistically significant)
| Beliefs subscale | “Incentivizing” goal support | “Risk-pooling” goal support | “Redistributing” goal support |
|---|---|---|---|
| Rewarding | 0.06 (0.00 to 0.11) p = 0.0434 | -0.11 (-0.16 to -0.05) p = 0.0001 | -0.15 (-0.20 to -0.09) p < 0.0001 |
| Random | 0.11 (0.05 to 0.16) p = 0.0002 | 0.21 (0.16 to 0.27) p < 0.0001 | 0.22 (0.16 to 0.27) p < 0.0001 |
| Rigged | 0.20 (0.14 to 0.25) p < 0.0001 | 0.32 (0.27 to 0.37) p < 0.0001 | 0.40 (0.35 to 0.45) p < 0.0001 |
For comparison, here are the same analyses done on the original data:
Correlations in original study data between each subscale and different goal types (not controlling for conservatism)
| Beliefs subscale | “Incentivizing” goal support | “Risk-pooling” goal support | “Redistributing” goal support |
|---|---|---|---|
| Rewarding | 0.01 (-0.04 to 0.07) p = 0.66897 | -0.17 (-0.22 to -0.11) p < 0.0001 | -0.22 (-0.27 to -0.16) p < 0.0001 |
| Random | 0.09 (0.04 to 0.15) p = 0.00115 | 0.23 (0.18 to 0.28) p < 0.0001 | 0.24 (0.19 to 0.30) p < 0.0001 |
| Rigged | 0.26 (0.20 to 0.31) p < 0.0001 | 0.41 (0.36 to 0.45) p < 0.0001 | 0.50 (0.45 to 0.54) p < 0.0001 |
Partial correlations between each subscale vs. different goal types (all correlations in this table are partial correlations controlling for conservatism; all are statistically significant)
| Beliefs subscale | “Incentivizing” goal support | “Risk-pooling” goal support | “Redistributing” goal support |
|---|---|---|---|
| Rewarding | 0.09 (0.04 to 0.15) p = 0.0011 | -0.05 (-0.11 to 0.00) p = 0.0551 | -0.08 (-0.14 to -0.03) p = 0.00428 |
| Random | 0.06 (0.00 to 0.11) p = 0.04856 | 0.18 (0.13 to 0.24) p < 0.0001 | 0.19 (0.14 to 0.25) p < 0.0001 |
| Rigged | 0.19 (0.13 to 0.24) p < 0.0001 | 0.31 (0.26 to 0.36) p < 0.0001 | 0.39 (0.34 to 0.44) p < 0.0001 |
Interpreting the Results
Commentary on the correlations tables
In all four tables above, there isn’t an appreciable difference between the Random-Risk-pooling correlation and the Random-Redistributing correlation. This is unsurprising, given that we already know hypothesis “f” (which posited that there would be a difference between how positively associated the Random subscale was with the Risk-pooling versus “Redistributing” goals) was not supported in either the original nor our replication.
We now turn our attention to the correlations in the “Rewarding” rows of all tables. In both our data and the original study, the Rewarding-Incentivizing correlation is very small – and it isn’t significant in the correlations that don’t control for conservatism. However, it is true that the correlation is still more positive than the correlation between the Rewarding subscale and the other two government goals. Thus, this row of the tables demonstrates an interesting thing about the method chosen for testing hypotheses a through to f – it’s possible for a relationship between a subscale and support for a particular goal to be more positive than the relationship between that subscale and the other goals, even if the actual subscale:goal-support relationship in question is negligible. In this case, the Rewarding Incentivizing (in some cases, not even statistically significantly so), but because of negative relationships between Rewarding and the other variables, it is still MORE positively related to Incentivizing than the other variables.
What the Study Results Do and Do Not Show
The original study’s results have mostly replicated here, which suggests that a given set of beliefs does tend to be more positively associated with certain corresponding belief-compatible government goals than with support for other government goals.
Something the original experiment did not examine is the opposite question: which sets of goal-congruent beliefs are most positively associated with support for a given government goal? The original study showed that a given subscale is more positively associated with support for the goal most compatible with that subscale than support for the other goals, but it did not show that a given goal is most supported by the theoretically-most-compatible subscale. (The latter statement is instead contradicted by the data from both the original and replication experiments.)
Although this was not the focus of the original study (and, consequently, the following point is made separately to the replication findings), an interesting pattern emerged in the correlations data associated with both the original and replication study datasets: the subscale that was most correlated with support for each government goal was actually the same across government goals: specifically, scores on the Rigged subscale was most correlated with support for all three government goals. From this result, it would appear that the set of beliefs in the Rigged subscale are more congruent with support for each of the government goals than either of the other sets of beliefs in the other subscales. If any readers of the original paper had instead interpreted the findings as implying that the best predictor of support for each goal had been the corresponding scale hypothesized to be related to it, then those readers may be surprised by these findings.
A comment on the different subscales
As mentioned above, in this study, it seems that the Rigged subscale (compared to the other subscales) had a higher correlation with support for all three government goals considered (compared to the other two subscales). This suggests that the Rigged subscale is more predictive of support for government-directed financial “Redistributing” goals (including redistribution done via three different mechanisms).
The government goals were designed to be compatible with specific sets of beliefs, but it seems possible that the wording of the “Incentivizing” government goal is not explicit enough about its intended outcome. Here is the “Incentivizing” goal again:
”The government should use resources to incentivize and enable people to pull themselves out of financial hardship and realize their full potential.”
Although it does mention the word “incentivize,” it does not explicitly state what exactly that word means or how it would be enacted. Also, it could be argued that the inclusion of the phrase “realize their full potential” might evoke particular connotations associated with the political left, which (we speculate) might have weakened the relationship between Rewarding subscale scores and levels of support for this government goal. Additionally, it is not certain that study participants interpreted this goal as being more about the government incentivizing people than about other potential ways of “enab[ling] people to pull themselves out of financial hardship.”
How surprising would it be if readers misinterpreted the results?
The authors gave clear and precise explanations of their hypotheses and of the way in which they tested them (which was through examining the significance of predefined interaction terms in a series of mixed-effects linear regressions). A careful reading of these methodological sections would be relatively immune to misinterpretation by a knowledgeable reader well-versed in the relevant methods.
However, we are not giving this paper a perfect rating for this criterion because there were two sections of the paper where text-based summaries of Study 2 were given which, if read in isolation, could leave readers at risk of misinterpreting what Study 2 actually examined and showed. These are highlighted below.
In the “Overview of Studies” section, the authors state:
“Next, we leverage these insights to test our predictions that policy messages highlighting Incentivizing, Redistributing, and Risk-pooling are more persuasive to individuals with lay theories that are high on the Rewarding, Rigged, and Random dimensions, respectively. In particular, we examine how beliefs about changes in financial well-being are associated with rated importance of different goals that a government may pursue (Study 2).”
To a reader, it could sound as if Study 2 is testing whether policy messages highlighting Incentivizing goals are more persuasive to people high on the Rewarding subscale (and whether similar things apply for the other goal-subscale pairs: i.e., “Redistributing” goals are more persuasive to people high on the Rigged subscale, and “Risk-pooling” goals are more persuasive to people high on the Random subscale).
In the summary above, the paper does not clarify which of three possible interpretations actually applies in the case of this study. A reader could interpret the quote above in any of the following ways (please note that the interpretations are not mutually exclusive – readers may also think that all explanations apply, for example):
- Policy messages highlighting Incentivizing goals are more supported by people high on the Rewarding subscale compared to how supported they are by people high on the other subscales. (If a reader had interpreted it this way and had not gone on to read and interpret the methodological details of Study 2, they would have come away with a misconstrual of what the results actually showed);
- Policy messages highlighting Incentivizing goals are more supported by people high on the Rewarding subscale compared to how supported the other goals are by people high on the Rewarding subscale. (If a reader had interpreted it this way, they would have come away with the correct impression of what Study 2 was doing); and/or
- There is a positive and non-negative relationship between each belief subscale and support for the most compatible government goal, both with and without controlling for conservatism. (If a reader had interpreted it this way, they would have been correct about the relationship between the Rigged subscale and support for the Redistributing government goal, as well as the relationship between the Random subscale and support for the Risk-pooling goal, but they would have been incorrect in the case of the Rewarding subscale’s correlation with support for the Incentivizing goal when conservatism is not controlled for. And when conservatism is controlled for, although there is a statistically significant positive correlation between the Rewarding subscale and support for the Incentivizing goal, this correlation is very small [0.09], suggesting that one’s score on the Rewarding subscale is not helpful in predicting one’s support for the Incentivizing goal.)
Interpretations of what it means to “uniquely” predict the rated importance of different goals
In the text immediately before Study 2, the authors state:
“We begin in Study 2 by examining how the Rewarding, Rigged, and Random dimensions uniquely predict rated importance of different goals that a government may pursue when allocating resources.”
Similarly, in the Discussion, the authors state:
“Study 2 shows that Rewarding, Rigged, and Random beliefs uniquely predict rated importance of Incentivizing, Redistributing, and “Risk-pooling” goals for social welfare policy, respectively.”
Readers could interpret these statements in multiple ways. If readers interpret these statements to mean that the Rewarding subscale is a unique predictor of support for the Incentivizing goal after controlling for the other subscales (e.g., by entering them all into a linear regression), this would probably constitute a misinterpretation, at least with respect to the original dataset. In a linear regression predicting support for the “Incentivizing” goal, the Rewarding subscale was not a statistically significant predictor, unless conservatism was also included as a predictor (see the appendices). However, in the case of the Rigged and Random subscales, these did uniquely predict support for the Redistributing and “Risk-pooling” goals respectively (in that they were significant predictors in a linear regression predicting support for those goals despite the other subscales also being included in those regressions), so readers would only be at risk of misinterpreting the statements above in relation to the Rewarding subscale. (In contrast, the Rewarding subscale was a unique predictor of support for the Incentivizing goal in our dataset, as described in the appendices.)
There is an alternative way in which readers might interpret the above statements which would be inaccurate for both the original and replication datasets. Upon reading the statements above, some readers might think that the Rewarding subscale is either the single best (or perhaps the only) predictor of support for the Incentivizing goal (and similarly for the other goals – the Rigged subscale is the best predictor of support for the “Redistributing” goal and the Random subscale is the best predictor of the “Risk-pooling” goal). However, this is not the case for either the Rewarding subscale or the Random subscale (in either the original or our replication dataset). Instead, the most important subscale predicting the level of support for all three goals was the Rigged subscale (in both the original and our replication dataset).
Only in the case of the Rigged subscale is it actually true that it is the single most correlated subscale with support for the “Redistributing” goal (i.e., it is more highly correlated with the “Redistributing” goal than both the other subscales). The same cannot be said about the Rewarding subscale (it’s actually the least correlated with the Incentivizing goal of the three subscales) nor about the Random subscale (as it isn’t as correlated with the “Risk-pooling” goal as the Rigged subscale is).
The paper does not show any indication of deliberately obscuring these observations – however, we are highlighting them here because it seems that even a thoughtful reader might not make these observations on their first reading of the paper. It is also possible that, even if they read the paper in full, readers may not realize that the Rewarding subscale has a small to negligible correlation with support for the Incentivizing goal. If readers had been able to review all the correlations data (as presented here) alongside the findings of the original paper, they may have been less likely to misinterpret the findings.
Conclusion
We give Study 2 of this paper a 5/5 Transparency Rating. We also found that the results mostly replicated in our separate sample, and the original authors’ main conclusions held up. We think that careful readers might misinterpret parts of the paper if they read them in isolation.
Author Acknowledgements
We would like to thank the original paper’s authorship team for their generous help in reviewing our materials and providing feedback prior to the replication, as well as for their thoughts on our results and write-up. (However, the responsibility for the contents of the report remains with the author and the rest of the Transparent Replications team.)
Many thanks also go to Spencer Greenberg for his feedback before and after the study was run, and to both him and Amanda Metskas for their input on earlier drafts of this report. Thank you to the predictors on the Manifold Markets prediction market for this study (which opened after data collection had been completed). Last but certainly not least, many thanks to our participants for their time and attention.
Response from the Original Authors
The original paper’s authorship team offers this response (PDF) to our report. We are grateful for their thoughtful engagement with our report.
Purpose of Transparent Replications by Clearer Thinking
Transparent Replications conducts replications and evaluates the transparency of randomly-selected, recently-published psychology papers in prestigious journals, with the overall aim of rewarding best practices and shifting incentives in social science toward more replicable research.
We welcome reader feedback on this report, and input on this project overall.
Appendices
Additional Information about the Study
What did participants do?
Participants…
- Provided informed consent.
- Answered two sets of questions (half the people answered the CAFU items first, and the other half answered it second; within each scale, the order of the questions was randomized):
- Causal Attributions of Financial Uncertainty (CAFU) scale (explained below)
- Government goal support (policy preferences) questions (explained below)
- Stated their political orientation, from strongly liberal (coded as a 1) to strongly conservative (coded as 7).
What did we do?
Both the original team and our team…
- Excluded participants who failed to give responses for all key variables.
- Created a version of the dataset where each participant’s set of three government goal support levels was split into three rows, with one row per government goal. This was done so that each individual rating could be treated as its own observation in the regressions (described in the next step).
- Ran some mixed-effects linear regression models, with government goal support as the dependent variable (DV), allowing for random intercepts for each goal at the subject level, and with independent variables that included the following: CAFU subscales, goal categories (the effects of which were investigated by selecting one goal category as the reference class and computing the effects of the other categories in comparison to that reference category), and interaction terms.
- Checked to see whether the following coefficients were significant (as they had been hypothesized to be by the original study team):
- “Rigged” ✕ (“Redistributing” goal vs. “Incentivizing” goal contrast)
- “Rewarding” ✕ (incentive goal vs. “Redistributing” goal contrast)
- “Rewarding” ✕ (incentive goal vs. “Risk-pooling” goal contrast)
- “Random” ✕ (“Risk-pooling” goal vs.”Incentivizing” goal contrast)
- “Rigged” ✕ (“Redistributing” goal vs. “Risk-pooling” goal contrast)
- “Random” ✕ (“Risk-pooling” goal vs. “Redistributing” goal contrast)
- Ran the same mixed-effects linear regression models and did the same checks described above, but this time also including political conservatism, and interactions between this variable and the goal categories, among the independent variables in the regressions.
Note that, in the original study, these analyses were some among multiple other analyses that were done. In our replication, as recorded in the preregistration, we only sought to check if the findings in the main results table of the original study would be replicable, so we only replicated the steps that were relevant to that table.
What were the sections about?
The Causal Attributions of Financial Uncertainty (CAFU) scale
In their paper, Krijnen et al. (2022) introduce a set of items designed to measure people’s beliefs about what causes financial well-being. In their studies, they introduce this concept like this:
“Consider the level of financial well-being of any individual – that is, their capacity to meet financial obligations and/or the financial freedom to make choices to enjoy life. Naturally, a person’s financial well-being may change from one year to the next. Take a moment to think about how the financial well-being of any individual may change from one year to the next.”
In their first study (not the focus of this replication), they developed the “Causal Attributions of Financial Uncertainty (CAFU)” scale, which measures the degree to which people think the following three distinct factors influence changes in financial well-being across time and/or across populations of people (though note that participants weren’t given these names for those factors, so as to avoid creating unnecessary social desirability effects). Below, we’ve listed the three factors are and what a high score on them would mean, as well as the specific questions that were asked to derive these scores:
- If someone has a high score on the Random subscale, they tend to believe financial well-being is unpredictable, random, or (to put it another way) determined by chance.
- A person’s change in financial well-being from one year to the next…
- …is something that has an element of randomness.
- …is determined by inherently unpredictable life events (e.g., getting robbed or winning the lottery).
- …is determined by chance factors.
- A person’s change in financial well-being from one year to the next…
- If someone has a high score on the Rigged subscale, they tend to believe that financial well-being is determined by their intiail status and wealth, or by the degree to which they or a group to which they belong tend to experience discrimination or favoritism in society.
- A person’s change in financial well-being from one year to the next…
- …depends on how much discrimination or favoritism the person faces.
- …is predictable because some groups will always be favored over others.
- …depends on the person’s initial status and wealth (i.e., rich tend to get richer and poor tend to get poorer).
- A person’s change in financial well-being from one year to the next…
- If someone has a high score on the Rewarding subscale, they tend to believe that financial well-being is a result of the degree to which someone works hard, is resourceful, skilful, or talented, and is able to solve problems when they arise.
- A person’s change in financial well-being from one year to the next…
- …is the result of how hard the person works.
- …tends to improve with the person’s resourcefulness and
- problem-solving ability.
- …is predictable if you know the person’s skills and talents.
- A person’s change in financial well-being from one year to the next…
In the CAFU Scale, participants select whether each element applies, from 1 (= not at all) to 7 (= very much). The intervening options are displayed as numbers only. Here is an example of one such question, as displayed in our replication:

Government goal support/policy preferences
In Study 2, in addition to being asked about the CAFU items, participants were shown the following:
“People differ in their beliefs about what the appropriate role(s) of the government should be. Below we briefly describe three distinct goals that the government might pursue.
For each statement, indicate to what extent you think that this is an important or unimportant goal for the U.S. government to pursue.“
Here are the government goals that participants were presented with. Note that participants were not provided with the labels (such as “redistribution”) associated with each goal (in case this influenced the social desirability of the goals). In each case, they were asked how important the goal was, from “Not important at all, 1” to “Extremely important, 7.”
- “Redistributing” goal:
- The government should allocate resources to individuals belonging to disadvantaged groups that routinely experience financial hardship.
- “Risk-pooling” goal:
- The government should pool resources to support people when they happen to experience unforeseeable financial hardship.
- “Incentivizing” goal:
- The government should use resources to incentivize and enable people to pull themselves out of financial hardship and realize their full potential.
The relationship between CAFU subscales and government goal support
The research team (and our replication) demonstrated that people’s scores on the CAFU subscales listed above appear to be more positively associated with support for government goals that are compatible with their beliefs (i.e., their beliefs in the statements outlined in that subscale) than with support for government goals that are more compatible with a different subscale. In other words, higher scores on the “Rigged” subscale (for example) will probably be more positively associated with the level of support for a government goal that tries to redistribute wealth (to counteract the forces in the “Rigged” system) than one that is more focused on another goal (like incentivizing people to create their own wealth).
They also found that these patterns (of greater positive associations between a given subscale and its support for government goals that are compatible with a given belief than with goals that are more compatible with other beliefs) still held when they controlled for participants’ reported political position (by including it in the regression model).
Additional Information about the Results
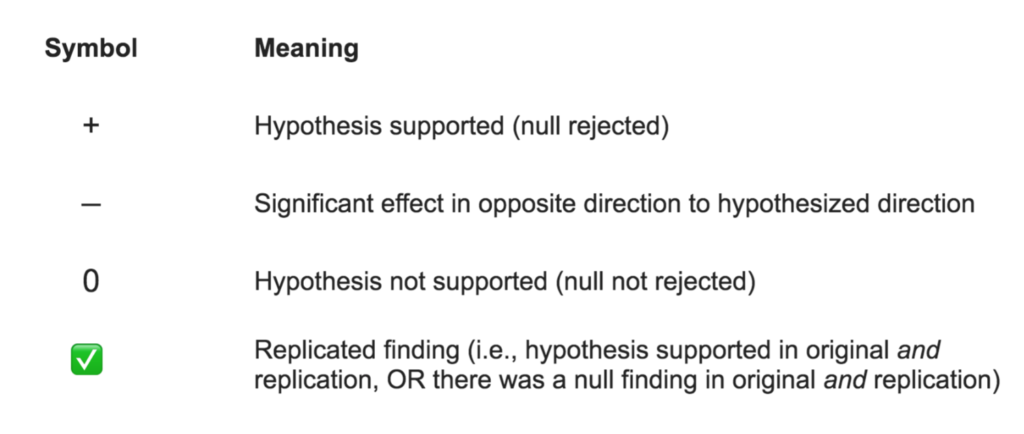
Results Key
The key below explains how to interpret the results columns in the Study Diagram.
Results Tables
The table below is taken from the original paper. Rows highlighted in green are those that replicated in our study. The yellow row did not replicate in our study.
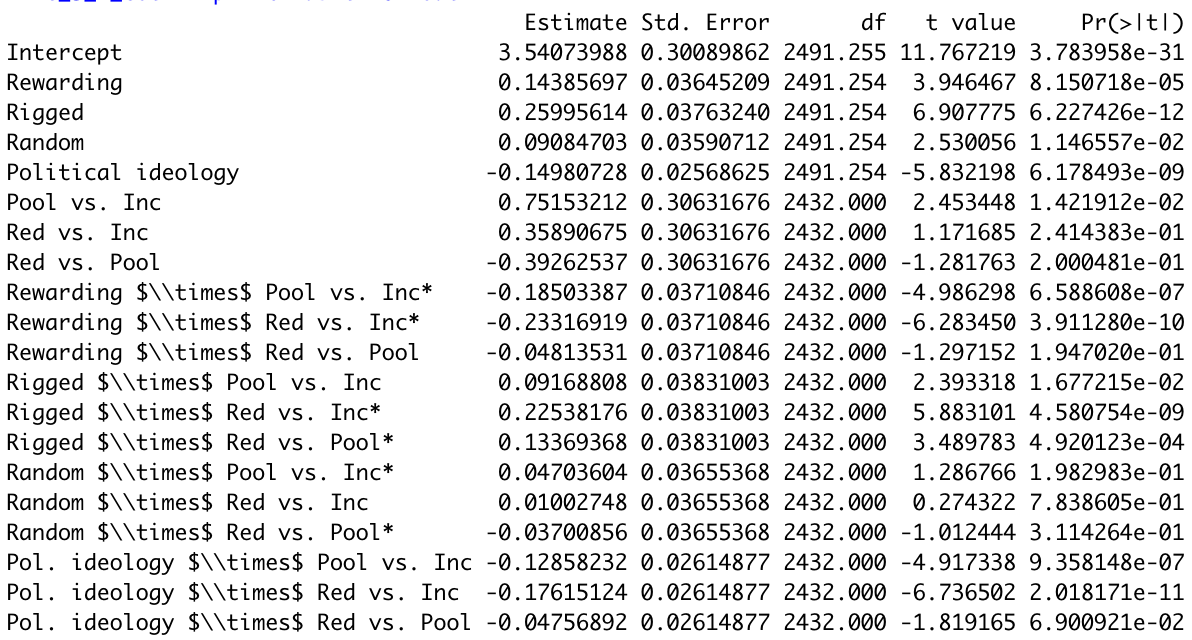
Here is our equivalent of the left side of the main results table in the study (labeled as Table 10 in the original paper), generated using the data from our replication:

Here is our equivalent of the right side of the main results table in the study (labeled as Table 10 in the original paper), generated using the data from our replication:
Additional Analyses
Linear regressions
We ran some simpler linear regressions predicting support for the three government goals on their own, to investigate one possible interpretation of the statements about the subscales being “unique predictors” of the government goals. The results for these regressions using our replication dataset can be viewed in this Jasp file. In the linear regressions predicting the level of support for each of the three government goals, using the three CAFU subscales (both when including conservatism among the predictor variables and when not including conservatism among the predictor variables), each of the three subscales was a statistically significant predictor of the level of support for the goal that was most aligned with that subscale. However, the Rewarding and Random subscales were not the most important respective predictors of the levels of support for the Incentivizing and Risk-pooling goals – instead, the most important subscale predicting the level of support for all three goals was the Rigged subscale.
The results for these regressions using the original dataset can be viewed in this Jasp file. As mentioned in the body of the text, in a linear regression predicting support for the Incentivizing goal, the Rewarding subscale was not a statistically significant predictor, unless conservatism was also included as a predictor. However, in the case of the Rigged and Random subscales, these did uniquely predict support for the Redistributing and Risk-pooling goals respectively (in that they were significant predictors in a linear regression predicting support for those goals despite the other subscales also being included in those regressions). Once again, though, as was the case for our replication dataset, the Rewarding and Random subscales were not the most important respective predictors of the levels of support for the Incentivizing and Risk-pooling goals – instead, the most important subscale predicting the level of support for all three goals was the Rigged subscale.
Sensitivity Analysis
Both the original study and our study had more than 3600 observations* that contributed to the regressions reported in the main results table in the original study (labeled as Table 10 in the original paper). *(This is because each individual rating was counted as a separate observation, and each person did three ratings.)
The original team did a post-hoc sensitivity analysis for a single coefficient in a multiple regression analysis with 11 predictors. We performed the same post-hoc sensitivity analysis in GPower 3.1 (Faul et al., 2009) and found the same minimum detectable effect size as the original team did. The minimum detectable effect with N = 3600 observations (i.e., for both the original and our experiment), α = .05, and 95% power is f2 = .007.
References
Faul, F., Erdfelder, E., Buchner, A., & Lang, A.-G. (2009). Statistical power analyses using G*Power 3.1: Tests for correlation and regression analyses. Behavior Research Methods, 41, 1149-1160. Download PDF
Krijnen, J. M., Ülkümen, G., Bogard, J. E., & Fox, C. R. (2022). Lay theories of financial well-being predict political and policy message preferences. Journal of Personality and Social Psychology, 122(2), 310. Download PDF
