Executive Summary
| Transparency | Replicability | Clarity |
|---|---|---|
13 of 17 findings replicated |
We ran a replication of study 3 from this paper, which assessed men’s and women’s beliefs about hypothetical scenarios in which they imagined applying to and working for technology companies with different ratios of men and women on staff (either 3:1 or 1:1). In the original study, when a company had a male:female staff ratio of 3:1 (even if its promotional materials display an equal balance of men and women), it was perceived as not being sincerely interested in increasing gender diversity, and women (but not men) were more likely to have identity threat concerns about working there (e.g., concerns about not having their contributions valued due to their gender). Also, both men and women (but especially women) tended to be less interested in working for that organization. These effects were mediated by the perception that the company was not sincerely interested in increasing gender diversity. Our findings were mostly consistent with those of the original study (see full report), except that we did not find that gender moderated the indirect effects of company diversity on interest in working for the company.
Full Report
Study Diagram

Replication Conducted
We ran a replication of Study 3 from: Kroeper, K. M., Williams, H. E., & Murphy, M. C. (2022). Counterfeit diversity: How strategically misrepresenting gender diversity dampens organizations’ perceived sincerity and elevates women’s identity threat concerns. Journal of Personality and Social Psychology, 122(3), 399-426. https://doi.org/10.1037/pspi0000348
How to cite this replication report: Transparent Replications, & Harris, C. D. (2022). Report #2: Replication of a study from “Counterfeit Diversity: How Strategically Misrepresenting Gender Diversity Dampens Organizations’ Perceived Sincerity and Elevates Women’s Identity Threat Concerns” (JPSP | Kroeper, Williams & Murphy 2022). Clearer Thinking.
https://replications.clearerthinking.org/replication-2022jpsp122-3
(Report DOI: https://doi.org/10.5281/zenodo.17716306)
Key links
- Read our pre-registration
- Download a .csv of our de-identified data
- View or copy our GuidedTrack code for the experiment (free login required to access)
- Preview the experiment
- Download our analysis scripts and files:
- The PROCESS script used (downloaded from Andrew Hayes’ site)
- Conditional process analysis script (you must run the script above before running this one)
- Manipulation check
- See the (inaccurate) predictions made about this study:
- See the Manifold Markets prediction market for this study – in that market, the community assigned an equal probability to 5, 6, 7, 8, 9, 10, 11, 12, or 13 findings replicating (of the 17 findings being considered), and they assigned each of those values 13.3 times higher probabilities than values outside that range. This works out to about a 10.3% chance of exactly 13 findings replicating according to Manifold.
- See the Metaculus prediction page for this study – Metaculus predicted that 7.5 of the 17 findings would replicate. According to Metaculus, there was about a 3% chance of 13 findings (12.5-13.5 findings) replicating.
- Download a PDF of the original paper
- View supporting materials for the original study on OSF
Overall Ratings
To what degree was the original study transparent, replicable, and clear?
| Transparency: how transparent was the original study? | Apart from aspects of the pre-registration process, this study had almost perfect ratings on all Transparency Ratings criteria. |
| Replicability: to what extent were we able to replicate the findings of the original study? | 17 statistically significant findings were identified as most relevant (to the key hypotheses) among the findings recorded in the two results figures in the original study. 13 of those 17 findings replicated (76.5%). |
| Clarity: how unlikely is it that the study will be misinterpreted? | The (i) methods &/or (ii) results could be misinterpreted if readers don’t read (i) the textbook about methods, &/or (ii) supplementary materials. |
Detailed Transparency Ratings
| Overall Transparency Rating: | |
|---|---|
| 1. Methods Transparency: | Publicly-accessible materials described the administration of the study in enough detail for us to be able to replicate the original study accurately. The scales used were publicly available and were easy to find within the OSF materials. |
| 2. Analysis Transparency: | The authors were very transparent about the analysis methods they used and readily communicated with us about them in response to our questions. Please see Appendices for details. |
| 3. Data availability: | All data were publicly available and were easy to find on the OSF project site. |
| 4. Pre-registration: | The authors pre-registered the study, but there were some deviations from this pre-registration, as well as a set of analyses (that formed the main focus of the discussion and conclusions for this study) that were not mentioned in the pre-registration. Please see Appendices for details. |
Summary of Study and Results
- The study assessed men’s and women’s beliefs about working for technology companies with different ratios of men and women (either 3:1 or 1:1) among their staff. Participants reacted to a hypothetical scenario in which they considered applying for, obtaining, then commencing a project management position in the tech industry.
- For an explanation of the statistical terms and analysis used in this write-up, please see the Explanations of statistical terms in the Appendix.
- The study’s findings were as follows. When a tech company had a male:female staff ratio of 3:1 (even if its promotional materials displayed an equal balance of men and women), it was perceived as not being sincerely interested in increasing gender diversity, and women (but not men) were more likely to have identity threat concerns about working there (e.g., concerns about being left out or stereotyped, or not having their contributions valued due to their gender). Also, both men and women (but especially women) tended to be less interested in working for that organization. These effects were mediated by the perception that the company was not sincerely interested in increasing gender diversity, and these indirect effects were moderated by participant gender.
- Our findings were mostly consistent with those of the original study (see details below), except that we did not find that gender moderated the indirect effects of company diversity on interest in working for the company via the perception of the company’s sincere interest in increasing gender diversity. Instead, we found that there were similarly significant indirect effects of company diversity on interest to work for the company, via the perception of the company’s sincere interest in increasing gender diversity, for both men and women. In their original paper, the authorship team had highlighted how experiments 1 and 2 had not shown this moderation relationship, while experiments 3 and 4 had.
Study Summary
This study assessed men’s and women’s interest in and hypothetical reactions to working for tech companies with different male:female staff ratios (either 3:1 or 1:1). Participants were asked to imagine applying for, obtaining, then commencing a project management position in the tech industry. At the application stage, they were shown recruitment materials that contained images of male and female staff in either a 3:1 or a 1:1 ratio (depending on which condition they had been randomized to).
Later, when participants imagined starting the project management role, they were told that the on-the-ground (actual) staff ratio that they witnessed on their first day at work was either a 3:1 or a 1:1 male:female staff ratio (again depending on which condition they had been randomized to).
The researchers assessed the perceived sincerity of the organization by asking participants two questions about the perceived sincerity of the company’s interest in improving gender diversity. They assessed identity threat by averaging the responses from six questions that asked participants the degree to which they would be concerned about being left out or stereotyped, not respected, or not having their opinion or contributions valued due to their gender.
The researchers then used multicategorical conditional process analysis (explained below) to show that:
- The perceived sincerity (of a company’s interest in increasing gender diversity) mediates the relationship between on-the-ground gender diversity and identify threat concerns – and this mediation relationship is moderated by participant gender; and
- The perceived sincerity (of a company’s interest in increasing gender diversity) also mediates the relationship between on-the-ground diversity and company interest post-measurements – and this mediation relationship is also moderated by participant gender.
What participation involved
To see what the study involved, you can preview it. In summary, once a given participant provided informed consent:
- They were randomized into one of four different conditions. The four different conditions are listed in the next section.
- They were shown three company site images about a project manager position in the technology industry. The content of the images depended on the condition to which they were assigned. Some participants saw a company that looks “gender diverse,” with a 50:50 gender split. Others see a company that appears to have a 3:1 male:female staff ratio.
- They were asked their level of interest in the project manager position at the company and were asked a series of questions about the images they reviewed. Questions associated with this part of the experiment were labeled as “T1” variables.
- They were asked to imagine obtaining and starting the project manager role at the technology company. They were told about the ratio of men to women observed during their first day on the job. Depending on the condition to which they have been randomized, some participants were told the actual ratio of men to women observed on their first day is 1:1, while others were instead told the ratio of men to women is 3:1.
- They were again asked their level of interest in the project manager position at the company and were asked a series of questions about the gender ratio that they have just been told about.
- Participants were also asked how “sincerely interested” in gender diversity the company seems to be. They were then presented with a series of identity threat questions, an attention check, and a question about their gender.
Perceived sincerity
The authors included this variable because they suspected that it would mediate the relationships between experimental conditions and both identity threat and company interest. The authors defined “perceived sincerity” as the average of the responses to the following two questions:
- To what extent do you think Harrison Technologies is sincerely interested in increasing gender diversity in their workforce? [Rated from “Not at all sincere”, 1, to “Extremely sincere”, 5]
- How believable is Harrison Technologies’ interest in increasing gender diversity in their workforce? [Rated from “Not at all believable”, 1, to “Extremely believable”, 5]
Identity threat
This was one of the key outcome variables in the experiment. The authors defined identity threat concerns as the average of the responses to the following six questions (which were rated from “Not at all”, 1, to “An extreme amount”, 5):
- How much might you worry that you won’t belong at the company?
- How much might you worry that you cannot be your true self at the company?
- How much might you worry about being left out or marginalized at the company?
- How much might you worry about being stereotyped because of your gender at the company?
- How much might you worry that others will not respect you at the company?
- How much might you worry that others will not value your opinion or contributions at the company?
Company/position interest
Participants’ interest in the hypothetical project manager position after they found out about the ratio of male to female staff on their first day at work (“Interest_T2”) was one of the key outcome variables in the experiment.
The authors defined Interest_T1 as the answer to the following question (which was asked after participants saw the company ad):
- Imagine that you are looking for a project manager position in the tech industry and you encountered the job advertisement on the Harrison Technologies’ website. How interested would you be in the project manager position at Harrison Technologies? [Rated from “Not at all,” 1, to “Extremely interested,” 5]
The authors defined Interest_T2 as the answer to the following question (which was asked after participants had been told about their hypothetical first day at work):
- After your first day on the job, how interested would you be in the project manager position at Harrison Technologies? [Rated from “Not at all,” 1, to “Extremely interested,” 5]
Diversity expectations
Diversity expectations were used for a manipulation check. The authors defined the diversity expectation variable (“diversityExpectation”) at time point 1 (“xDiversityExpecationT1”) as the average of the responses to the following two statements (which were rated from “Strongly Disagree”, 1, to “Strongly Agree”, 7):
- I expect Harrison Technologies to be *gender diverse.*
- I expect to find a *predominantly male* workforce at Harrison Technologies. [Scoring for this response was reversed.]
The authors defined the diversity expectation variable at time point 2 (“xDiversityExpecationT2”) the average of the responses to the following two statements (which were rated from “Strongly Disagree”, 1, to “Strongly Agree”, 7):
- After my first day of work at Harrison Technologies, I learned the company is *gender diverse.*
- After my first day of work at Harrison Technologies, I learned the company has a *predominantly male* workforce. [Scoring for this response was reversed
Conditional Process Analysis
For an explanation of the terms used in this section, please see Explanations of statistical terms in the appendices. The analysis used both in the original study and our replication is a so-called conditional process analysis, following Andrew Hayes’ PROCESS model. It is described in his book Introduction to Mediation, Moderation, and Conditional Process Analysis: A Regression-based Approach. Hayes lays out various different ways in which moderation and mediation can occur in the same model. If you aren’t familiar with the terminology in this section, please see the Glossary of Terms in the appendices.
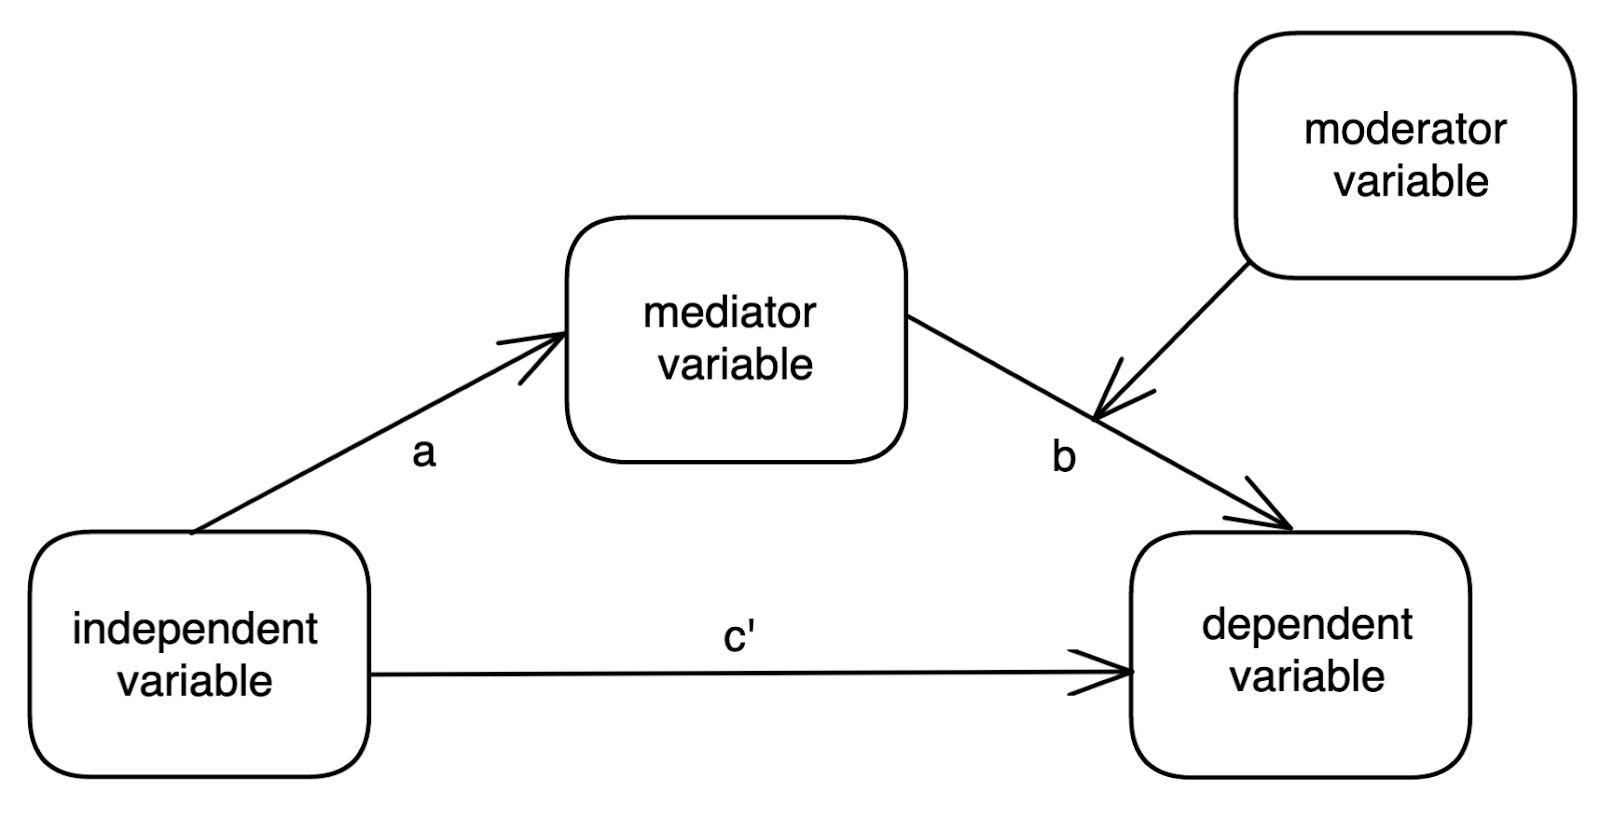
A brief summary is given here of the particular model that the original study authors tested (known as “model 14”): in this model, there is:
- An independent variable (which can be categorical, as in this study),
- A dependent variable,
- A mediator variable (that mediates the relationship between the independent and the dependent variable), and
- A moderator variable (that, in this particular model, moderates the relationship between the mediator variable and the dependent variable).
These variables are shown below, along with the names that are traditionally given to the different “paths” in the model.
In the diagram below…
- The “a” path (from the independent variables to the mediator variable) is quantified by finding the coefficient of the independent variable in a linear regression predicting the mediator variable.
- The “b” and “c’ ” paths are quantified by finding the coefficients of the mediator and independent variables (respectively) in a regression involving the dependent variable as the outcome variable and all other relevant variables (the independent variable, the mediator variable, the moderator variable, and a mediator-moderator interaction term) as the predictor variables.
In Hayes’ book, he states that mediation can be said to be occurring (within a given level of the moderator variable) as long as the indirect effect is different from zero – i.e., as long as the effect size of ab (i.e., the path from the independent variable to the dependent variable via the mediator variable) is different from zero. He states that the significance of the a and b paths on their own are not important, and that it is the product of the paths (ab) that determines whether the indirect effect can be said to be significant.
The “multicategorical” term used in the current study is referring to the fact that the independent variable is of a categorical nature (in this case, the different categories consisted of different contrasts between experimental conditions).
Results from the Conditional Process Analysis
As mentioned above, in the original study, the researchers used multicategorical conditional process analysis to show that:
- The perceived sincerity (of a company’s interest in increasing gender diversity) mediated the relationship between actual on-the-ground gender diversity and identify threat concerns – and this mediation relationship was moderated by participant gender.
- The perceived sincerity (of a company’s interest in increasing gender diversity) also mediated the relationship between on-the-ground diversity and company interest (measured at the end) – and this mediation relationship was also moderated by participant gender.
Our replication
To replicate this study, we used the same methods described above, and undertook the same analyses as those described above. Many thanks to the original study team for reviewing our replication materials prior to the study being run. As per our pre-registration document, our main aim here was to see if we could reproduce our own version of the original study’s results figures (labeled as Figures 8 and 9 in the original paper), but as we explain later, these were not the only (and arguably were not the most important) results relevant to our replication attempt.
We ran our experiment via GuidedTrack.com and recruited study participants on Positly.com. The original study had a total of 505 U.S. adults (after accounting for exclusions) and our study had a similar total (523 U.S. adults after accounting for exclusions). In both the original and our replication, all participants were either male or female (and approximately 50% were female; those who were non-binary or who did not reveal their gender were excluded).
To experience our replication study as study participants saw it, click here. The images and scenario that you are given will change across multiple repetitions of the preview.
Experimental conditions
As in the original experiment, participants were randomly assigned to one of four conditions, listed below (with a probability of 0.25 of going to any one of the four conditions).
Condition 0 = Authentically Diverse: participants in this condition were…
- Shown company site images with a 50:50 gender split (i.e., they see an equal number of men and women featured on the Harrison Technologies website)
- Told that the gender split on the ground on their first day is again 3:1 men:women
Condition 1 = Aspirational Diversity: participants in this condition were…
- Shown company site images with a 3:1 male:female gender ratio
- Told that the gender split on the ground on their first day is 3:1 men:women
- Given a statement from top company executives stating that the company isn’t yet where it wants to be in terms of gender diversity, but that they’re working toward increasing gender diversity in the future
Condition 2 = Authentic NonDiversity: participants in this condition were…
- Shown company site images with a 3:1 male:female gender ratio
- Told that the gender split on the ground on their first day is 3:1 men:women
Condition 3 = Counterfeit Diversity: participants in this condition were…
- Shown company site images with a 50:50 gender split
- Told that the gender split on the ground on their first day is 3:1 men:women
Detailed Results
The results are summarized below, but you can find a more detailed overview in the appendices. The findings that we aimed to reproduce are shown in Figures 8 and 9 in the original paper (copied below).
Figure 8 in the original paper illustrated how identity threat concerns were affected by the different diversity conditions (listed above) and perceived “sincerity” levels (as measured in this survey). Below is a copy of the original figure, with the numbers we derived from our data added in colored (green and dark red) writing beside the original study’s numbers.
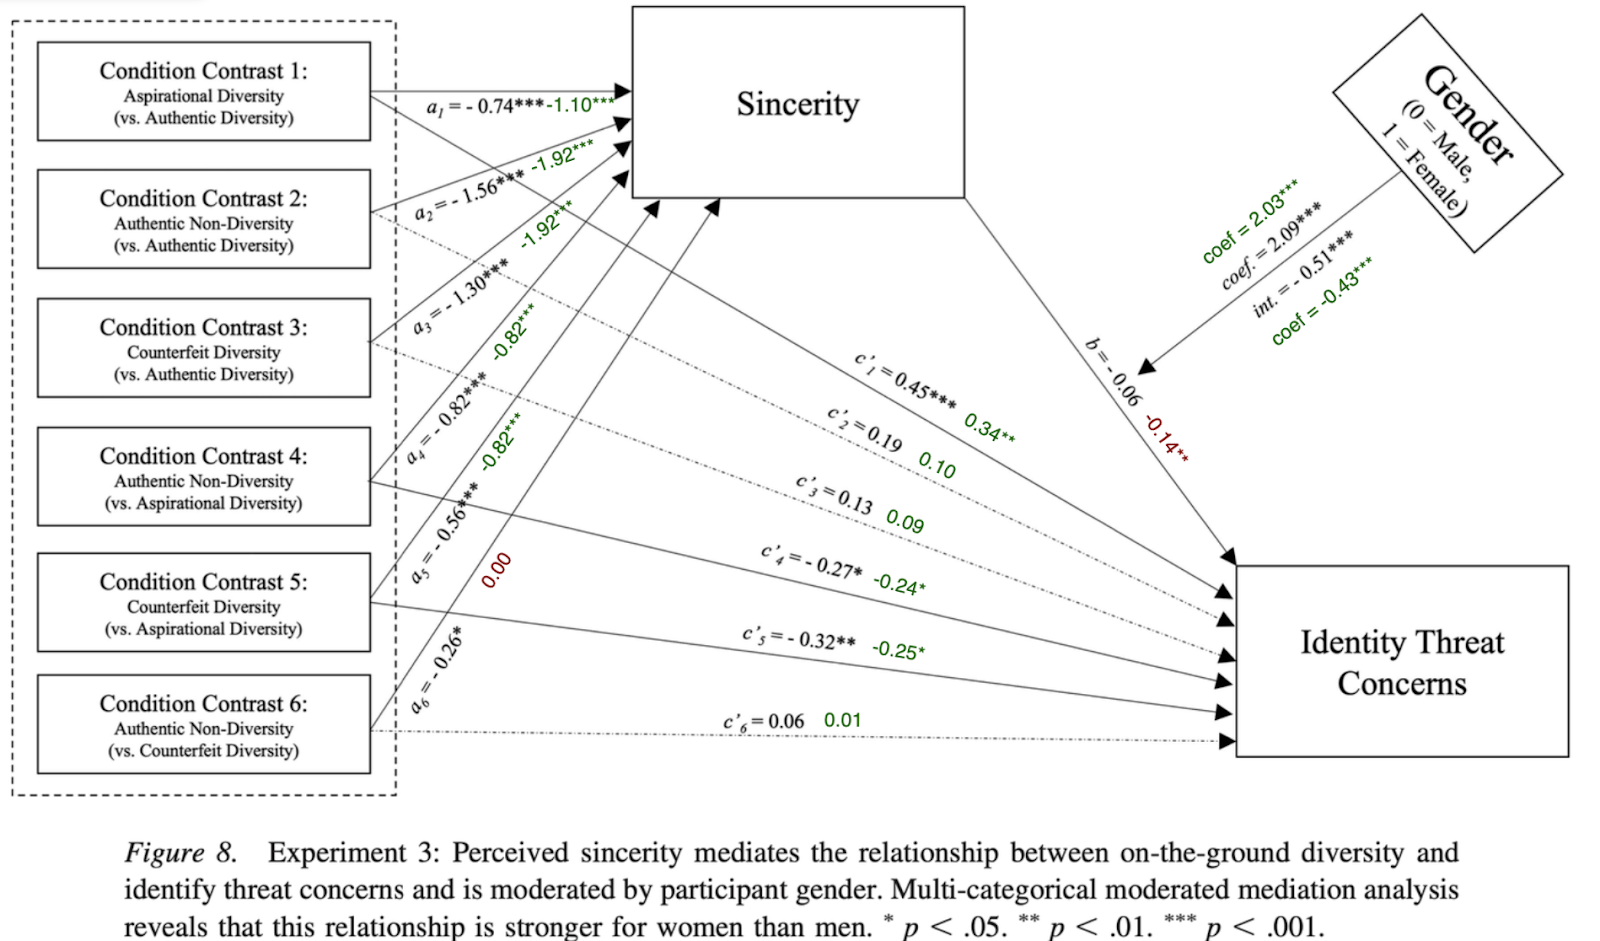
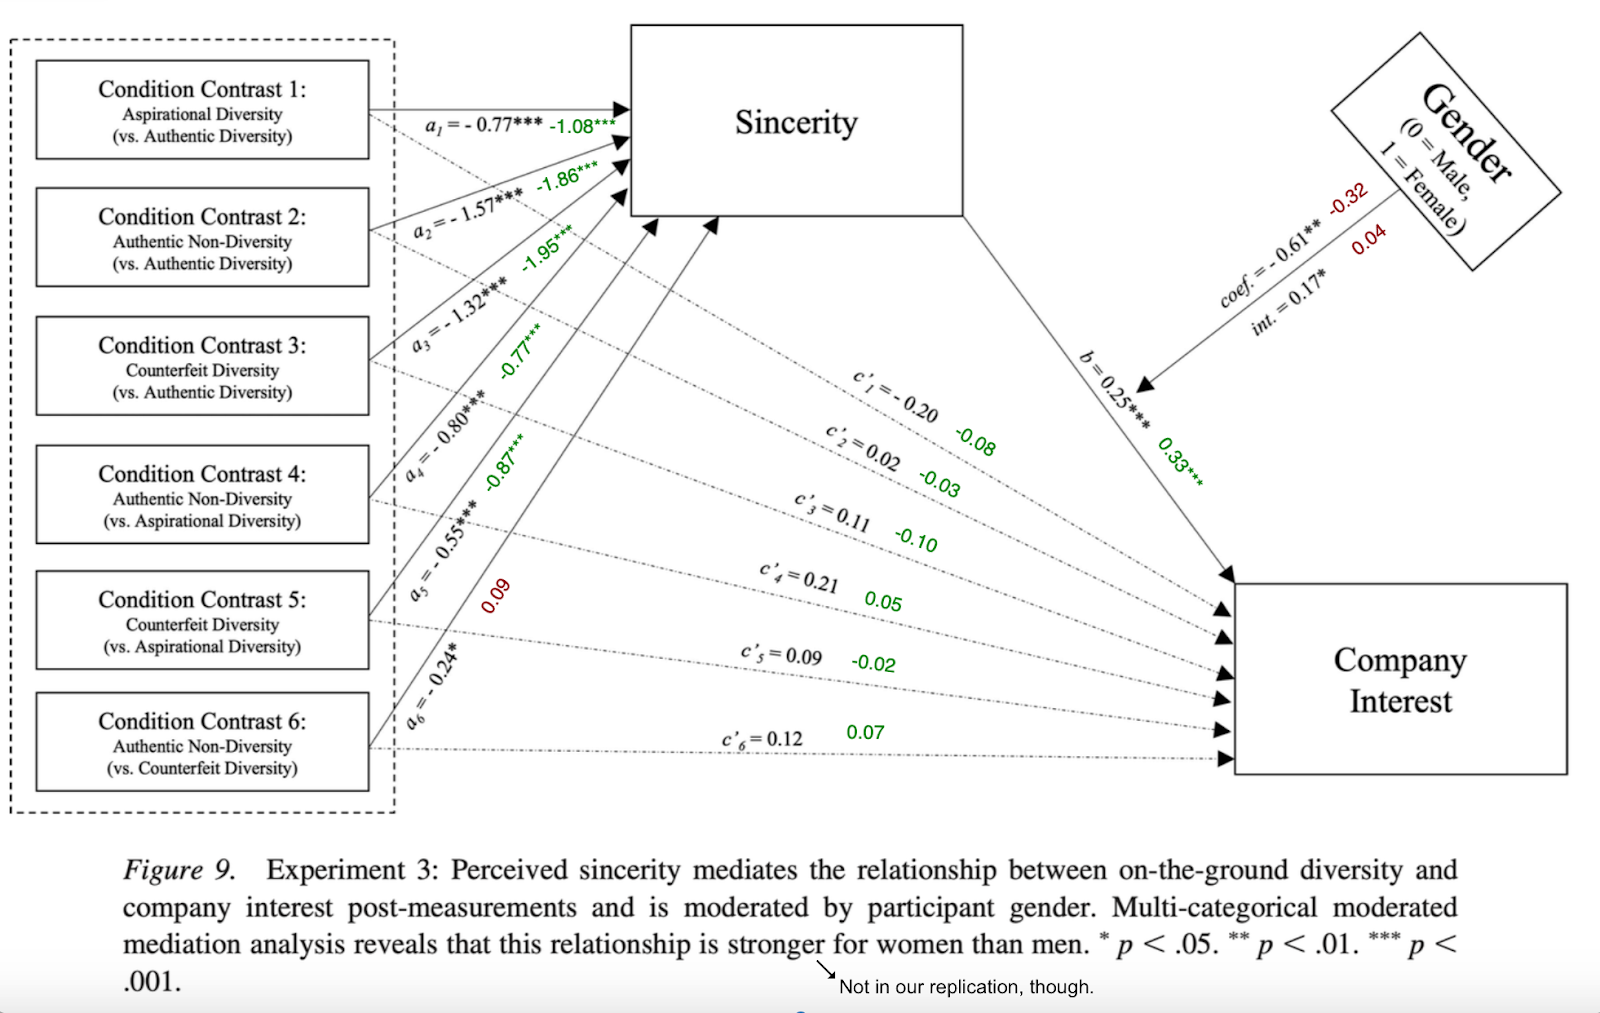
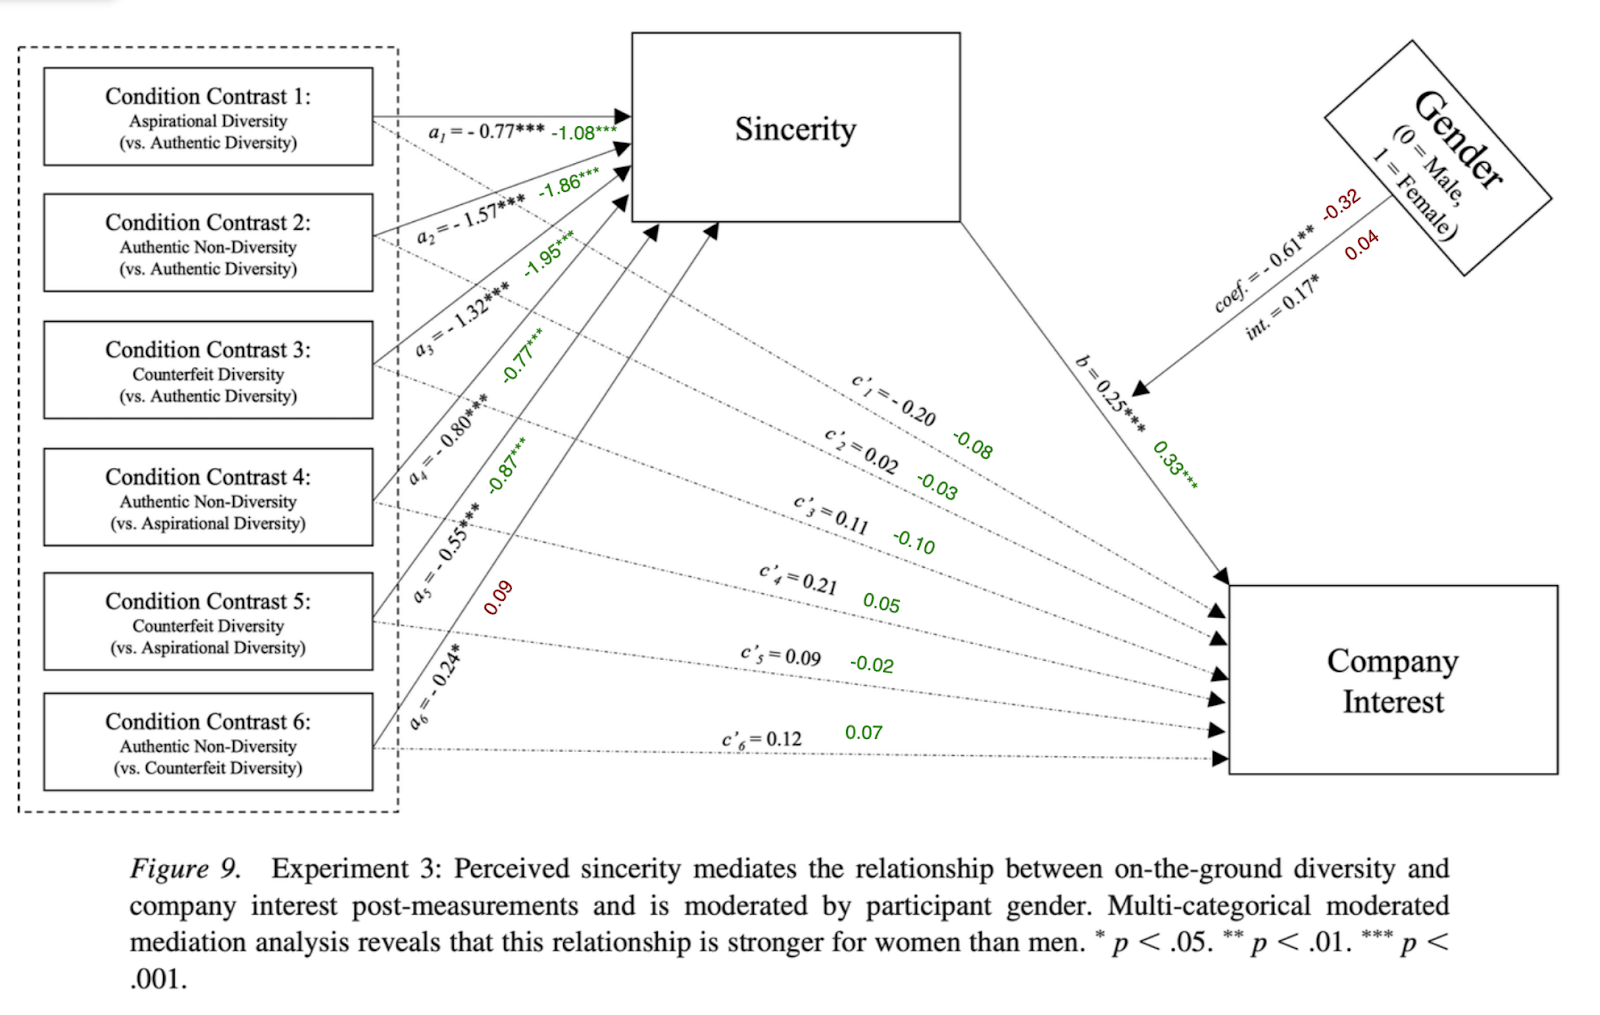
Figure 9 in the original paper illustrated how the reported level of interest in a project manager position at a hypothetical tech company were affected by the different diversity conditions (explained above) and perceived “sincerity” levels (as measured in this study). Furthermore, in the original study, the relationship between “sincerity” and the aforementioned interest levels was moderated by gender, but this was not the case in our replication. Below is a copy of the original figure, with the numbers we derived from our data added in colored (green and dark red) writing beside the original study’s numbers.
Across Figures 8 and 9 above, there are a total of 13 significant results (marked with asterisks) along the “a” and “b” paths combined (the c’ path is not the focus here), plus four significant results relating to the effects of gender. This gives a total of 17 significant results in the parts of the diagrams that are most relevant to the authors’ hypotheses. Of these 17 findings, 13 of them (76.5%) were replicated in our study.
The findings from the figures above are described in written form in the appendices.
Indirect Effects Results
One could argue that the results figures (above) do not show the most relevant results. According to the textbook that the authors cite (and that forms the main source of information on this analysis method):
“You absolutely should focus on the signs of a and b when talking about the indirect effect. Just don’t worry so much about p-values for these, because you care about ab, not a and b.”
Depending on how one interprets this, the results recorded in supplementary tables S11 and S12 (in the supplementary material for the original paper) were arguably more important than the results shown in the figures, at least according to the textbook on conditional process analysis quoted above. (It may even be that Figures 8 and 9 could have potentially been relegated to the supplementary materials if needed.)
Indirect effects of experimental conditions on identity threat via “perceived sincerity”
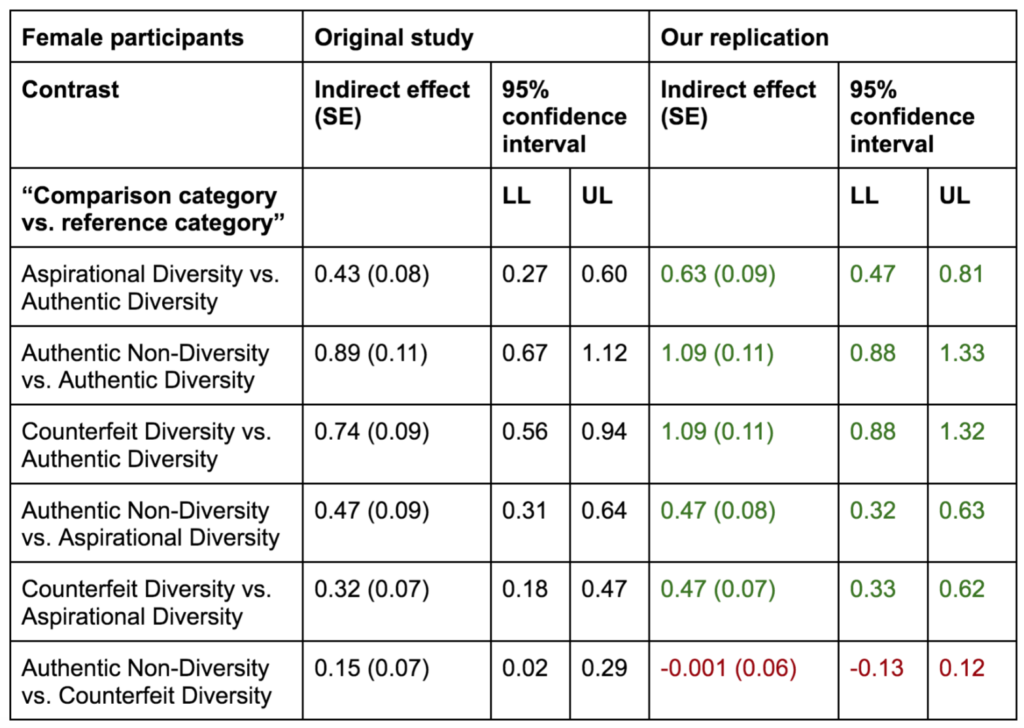
In the original study, among female participants, the authors found significant indirect effects of each of the condition contrasts on identity threat concerns via “perceived sincerity.” We replicated all of those findings except for one: unlike the original study, we found no significant indirect effects of authentic non-diversity (compared to counterfeit diversity) on identity threat concerns via perceived sincerity.
Note that the original authorship team had also observed and reported on differences across studies regarding whether there were differences in the effects of authentic non-diversity compared to counterfeit diversity on identity threat concerns. More specifically, although they found a difference between these conditions in Study 3 (the focus of this replication), in Study 2 of their paper, they had found no such difference. They highlighted this in their paper. In the conclusion of their paper, they wrote: “Consistent with an active, dynamic construal process of situational cues, we found that authentically diverse companies were perceived to be the most sincerely interested in gender diversity, followed by aspirational diversity companies, and then followed by counterfeit diversity and authentic nondiversity companies—which usually did not differ from each other in engendering threat and lowering interest.”
Within female participants, almost all experimental conditions had indirect effects on identity threat concerns via “perceived sincerity”…
| Originally, there were significant indirect effects of… | on… | via… | Did we replicate this finding? |
|---|---|---|---|
| Aspirational Diversity compared to Authentic Diversity | identity threat concerns | “perceived sincerity” | ✅ |
| Authentic Non-Diversity compared to Authentic Diversity | identity threat concerns | “perceived sincerity” | ✅ |
| Counterfeit Diversity compared to Authentic Diversity | identity threat concerns | “perceived sincerity” | ✅ |
| Authentic Non-Diversity compared to Aspirational Diversity | identity threat concerns | “perceived sincerity” | ✅ |
| Counterfeit Diversity compared to Aspirational Diversity | identity threat concerns | “perceived sincerity” | ✅ |
| Authentic Non-Diversity compared to Counterfeit Diversity | identity threat concerns | “perceived sincerity” | ❌ |
In the original study, the authors also found that gender significantly moderated the indirect effects of each of the condition contrasts on identity threat concerns via perceived sincerity. We again replicated all of those findings except one: in our data, gender did not significantly moderate the indirect effects of authentic non-diversity (compared to counterfeit diversity) on identity threat concerns via perceived sincerity (which is unsurprising, given these indirect effects weren’t significant in the first place).
Within all participants…gender moderated experimental conditions’ indirect effects on identity threat concerns via “perceived sincerity”…
| Originally, gender moderated the indirect effects of… | on… | via… | Did we replicate this finding? |
|---|---|---|---|
| Aspirational Diversity compared to Authentic Diversity | identity threat concerns | “perceived sincerity” | ✅ |
| Authentic Non-Diversity compared to Authentic Diversity | identity threat concerns | “perceived sincerity” | ✅ |
| Counterfeit Diversity compared to Authentic Diversity | identity threat concerns | “perceived sincerity” | ✅ |
| Authentic Non-Diversity compared to Aspirational Diversity | identity threat concerns | “perceived sincerity” | ✅ |
| Counterfeit Diversity compared to Aspirational Diversity | identity threat concerns | “perceived sincerity” | ✅ |
| Authentic Non-Diversity compared to Counterfeit Diversity | identity threat concerns | “perceived sincerity” | ❌ |
Indirect effects of experimental conditions on job interest via “perceived sincerity”
In the original study, there were significant indirect effects of each condition contrast on job interest level at time point 2 via “perceived sincerity” (with job interest at time point 1 included as a covariate in this analysis). We replicated all of these findings, with one exception: unlike the original study, we found no significant indirect effects of authentic non-diversity (compared to counterfeit diversity) on company interest via perceived sincerity. Once again, however, note that the original authorship team had also observed and reported on differences across studies in the effects of authentic non-diversity compared to counterfeit diversity on company interest. As mentioned previously, in their conclusion, they wrote, “counterfeit diversity and authentic nondiversity companies… usually did not differ from each other in engendering threat and lowering interest.”
Within both male and female participants, almost all experimental conditions had indirect effects on interest at time point 2 (with interest at time point 1 entered as a covariate) via “perceived sincerity”…
| Originally, there were significant indirect effects of… | on… | via… | Did we replicate this finding? |
|---|---|---|---|
| Aspirational Diversity compared to Authentic Diversity | company interest | “perceived sincerity” | ✅ |
| Authentic Non-Diversity compared to Authentic Diversity | company interest | “perceived sincerity” | ✅ |
| Counterfeit Diversity compared to Authentic Diversity | company interest | “perceived sincerity” | ✅ |
| Authentic Non-Diversity compared to Aspirational Diversity | company interest | “perceived sincerity” | ✅ |
| Counterfeit Diversity compared to Aspirational Diversity | company interest | “perceived sincerity” | ✅ |
| Authentic Non-Diversity compared to Counterfeit Diversity | company interest | “perceived sincerity” | ❌ |
In the original study, the authors also found that gender significantly moderated the indirect effects of each of the condition contrasts on job interest at time point 2 via perceived sincerity. Unlike the original study, we found no evidence of gender moderating the indirect effects of diversity condition on company interest via sincerity perceptions (i.e., men and women did not differ in the degree to which the impact of diversity condition on company interest was mediated by “perceived sincerity” – the index of moderated mediation was not different from zero).
Within all participants, in the original study, gender mediated the experimental conditions’ indirect effects on interest at time point 2 (with interest at time point 1 entered as a covariate) via “perceived sincerity” – but in our replication, we found no such mediation by participant gender…
| Originally, gender moderated the indirect effects of… | on… | via… | Did we replicate this finding? |
|---|---|---|---|
| Aspirational Diversity compared to Authentic Diversity | company interest | “perceived sincerity” | ❌ |
| Authentic Non-Diversity compared to Authentic Diversity | company interest | “perceived sincerity” | ❌ |
| Counterfeit Diversity compared to Authentic Diversity | company interest | “perceived sincerity” | ❌ |
| Authentic Non-Diversity compared to Aspirational Diversity | company interest | “perceived sincerity” | ❌ |
| Counterfeit Diversity compared to Aspirational Diversity | company interest | “perceived sincerity” | ❌ |
| Authentic Non-Diversity compared to Counterfeit Diversity | company interest | “perceived sincerity” | ❌ |
Note that, in their original paper, the authorship team had highlighted how experiments 1 and 2 had not shown that gender moderated the indirect effects of diversity condition on company interest via perceived sincerity, while experiments 3 and 4 had. In their correspondence with us prior to data collection, the original authorship team again flagged this discrepancy between studies with us, and had correctly predicted that this moderation relationship might be less likely to replicate than others.
Summary of additional analyses
Manipulation check
As planned in our pre-registration, we also conducted a manipulation check (a repeated measures two-way analysis of variance [ANOVA] examining the effects of diversity condition and time point on the diversityExpectation variable), the results of which were significant (consistent with the manipulation having been successful) – see appendices for details. We note that, in both the original dataset and in ours, the diversityExpectation variable had kurtosis values exceeding 1 in magnitude; since non-normally distributed data presents a problem for ANOVAs, the original study authors had said (in their pre-registration) that skew or kurtosis values exceeding 1 in magnitude would lead them to conduct a transformation prior to conducting analyses, but they do not appear to have done that in their final paper.
Correlation between “perceived sincerity” and identity threat among women
As additional analyses outside of our replication, we also showed that, among women, “perceived sincerity” (with respect to interest in increasing gender diversity) was statistically significantly negatively correlated with identity threat concerns (Pearson’s r = -0.65, p = 1.78E-32).
Correlation between “perceived sincerity” and company interest
We also found that there was a statistically significant positive correlation between “perceived sincerity” (with respect to interest in increasing gender diversity) and interest in working for the company at the second time point, for both men (Pearson’s r = 0.51 , p = 1.4E-18) and women (Pearson’s r = 0.57, p = 7.2E-24).
We also conducted exploratory analyses – see the appendices for details of the additional analyses we conducted.
Interpreting the Results
The methods and results were explained quite transparently, but there would still be room for readers to misinterpret certain things. Areas where possible misinterpretations could arise are briefly described under headings below.
Interpretation of the study methods
Although the authors list their study methods and cite where further information can be found, readers would need to consult those external information sources in order to be sure to understand what the results are showing. The method chosen – conditional process analysis – is described in only a few places outside of the definitive textbook on the topic, which may limit the accessibility of methodological explanations for many readers. (In fact, this textbook, now in its third edition, appears to us to be the only definitive textbook describing the analysis method employed in this study. We were fortunate to have library access to the textbook to refer to for our study, but many potential readers would not have this.)
We acknowledge that it is common practice for authors to mention (or to very briefly describe) an analysis method without fully explaining it and/or by referring readers to other sources. However, we do think this point is nevertheless worth mentioning because it leaves room for readers to be more likely to misinterpret the findings of the study.
Interpretation of the relative importance of different results
The only results figures for this study were Figures 8 and 9, which were shown earlier. However, as discussed above, according to the textbook on conditional process analysis, the combined indirect effect size (ab) is more important than the individual effect sizes (along the a and b paths individually). So, in order to stay aligned with the recommendations of the creator of the analysis method they used, it might have been advisable not to display those results figures in the main body of the text and to instead display them in supplementary materials. By placing them in the main body of the text, it may lead readers to believe that those findings are among the most important ones of the study.
Interpretation of the “sincerity” variable
It could be argued that the “sincerity” variable could have been labeled more precisely. If a reader were only to read the abstract or were only to read Figures 8 and 9, for example, they may not realize that “sincerity” was not referring to the perceived sincerity of the company in general, but was instead referring to the average of the responses to two questions that both related to the company’s sincere interest in increasing gender diversity.
Sincerity, broadly construed, would not usually be assumed to mean sincere interest in increasing gender diversity. Consequently, some readers may be at risk of misinterpreting the mediation variable due to the broad label given to the “sincerity” variable. It would be unfortunate if some readers incorrectly interpreted the current study’s findings as being related to a more broadly-construed concept of sincerity (as opposed to the concept of perceived sincerity as defined in this particular paper).
Interpretation of “gender diversity”
Readers may infer that participants in the study knew what was meant by “increasing gender diversity” by the time they were asked how sincerely the company was in doing this, but this is debatable. Participants may have inferred the meaning of this term from the context in which they were reading it, but if they did not infer the meaning from the context, some may have wondered whether “gender diversity” was referring to a diverse range of different genders in the company, including non-binary genders (which is recognized elsewhere as a valid, though less common, interpretation of the phrase).
Such an interpretation might give a (very) tentative explanation as to why male participants also appeared to report slightly more identity threat concerns in the less diverse workplace scenarios than the diverse workplace scenarios (rather than only female participants exhibiting this). Perhaps some assume (based on certain stereotypes surrounding ideas of “bro”/“dude culture”) that a workplace with predominantly men would be less understanding of different sexualities, and/or of non-conformity to traditional gender norms (and with respect to this latter point, it may be worth noting that even those who do identify as either male or female may not conform to traditional expectations in some ways).
Apart from those in the “Aspirational Diversity” condition, who were told that there was a statement from top company executives “about gender diversity” and were then given a statement that talked about increasing the representation of women at the company, no other arms of the experiment mentioned “gender diversity” until the questions were shown asking about the company’s sincere interest in increasing it. (This may not be a problem, but would complicate the interpretation of results if it turned out that participants in the other experiment arms did not know what was meant by “gender diversity.”)
Interpretation of “increasing gender diversity”
To gauge “sincerity,” participants were asked the degree to which Harrison Technologies is sincerely interested in increasing gender diversity in their workforce. Even if we assume that all participants had the same understanding of the phrase “gender diversity” (discussed above), the meaning of the phrase “increasing gender diversity” still leaves room for multiple possible interpretations. It could be argued that a workplace that already demonstrates a 50:50 gender split (within the subset of people who identify as having either one of the binary genders) cannot be more diverse than it already is (since any change in the proportion of men and women would then be making the workplace either predominantly male or predominantly female, and neither of those outcomes would be more “gender diverse” than a 50:50 split). This makes it difficult to interpret the meaning of “increasing gender diversity.”
As alluded to earlier, other participants might have been imagining that “increasing gender diversity” would involve increasing the proportion of people in the workplace who identify as neither male nor female. If that was the interpretation, it would seem that participants’ responses were not only shaped by the balance of men and women at the company, but also whether they inferred the balance would give a clue as to whether the workplace would try to hire more people who identify as neither male nor female.
This potential for different interpretations on the part of participants also translates into a potential interpretation difficulty for readers of this study. If participants in some conditions had varying ideas of what a sincere interest in “increasing gender diversity” entailed, then readers of this study would need to interpret results differently. More specifically, if participants were interpreting the idea of “increasing gender diversity” differently to how they were intended to interpret it, this would complicate our interpretations of all of the mediation relationships found in this study.
Conclusion
We randomly selected a paper from a March JPSP journal, and within that paper, we focused on Study 3 because its findings appeared to be non-obvious in addition to being key to the authors’ overall conclusions. The study was described transparently in the paper and was feasible for us to accurately replicate using only publicly-available materials. This is a testament to the open science practices of the authors and JPSP. There were some minor points which required clarification prior to us running our replication study, and the authors were very helpful in answering our questions and ensuring that our study was a faithful replication of theirs. Our replication study had findings that were mostly consistent with the original study. One interesting difference was that, in our study, the indirect effects of diversity condition on company interest via “perceived sincerity” were not mediated by participant gender (unlike in the original study).
Notwithstanding the transparency and replicability of the original study, there were several aspects of the write-up that could have increased the probability that readers would misinterpret what was being shown or said. The main aspects we identified as potentially problematic were as follows:
- The analysis methods were described clearly in the paper, but were not explained. Instead, the authors referred to a textbook, which we later found out is the only definitive resource on the analysis method employed in this study.
- We acknowledge that it is common practice for authors to mention an analysis method without fully explaining it and by referring readers to other sources. However, we do think it is worth mentioning because it leaves room for readers to be more likely to misinterpret the findings of the study.
- Several terms were used when describing results that could reasonably be interpreted as meaning something different to what they actually meant, and readers would only have identified this problem if they had read the scales used (by referring to the supplementary materials).
- If participants in the study had understood the idea of “increasing gender diversity” in a different way to how it was intended to be understood, this would complicate our interpretation of all of the mediation relationships found in this study.
Purpose of Transparent Replications by Clearer Thinking
Transparent Replications conducts replications and evaluates the transparency of randomly-selected, recently-published psychology papers in prestigious journals, with the overall aim of rewarding best practices and shifting incentives in social science toward more replicable research.
We welcome reader feedback on this report, and input on this project overall.
Author Acknowledgements
The original study team gave us prompt and helpful feedback which greatly improved the quality of our replication. The authors also provided helpful feedback on an earlier draft of this report. (However, the responsibility for the contents of the report remains with the author and the rest of the Transparent Replications team.)
Many thanks also go to Spencer Greenberg and Amanda Metskas for their feedback throughout the study process and for their input on earlier drafts of this report. Thank you to Nikos Bosse for helping to post about the study on Metaculus, and to our Ethics Evaluator for their time reviewing the study before we ran it. Last but certainly not least, many thanks to our participants for their time and attention.
Appendices
Additional Information about the Ratings
Expanding on the Transparency Ratings
1. Methods transparency (5 stars):
1-a: The methods and publicly-accessible materials described the administration of the study in enough detail for us to be able to replicate the original study accurately. Consequently, we gave the highest possible rating for this sub-criterion.
1-b: The scales used were publicly available and were easy to find within the OSF materials. Consequently, we gave the highest possible rating for this sub-criterion.
2. Analysis Transparency (4.5 stars):
The authors were very transparent about the analysis methods they used and readily communicated with us about them in response to our questions. They lost half a star because one of the SPSS files on the OSF site for the project listed an incorrect model number which would have resulted in different results to those shown in the manuscript. However, this was considered to be a relatively minor oversight – it was easy for us to find because the model had been recorded accurately in the body of the paper.
3. Data availability (5 stars):
All data were publicly available and were easy to find on the OSF project site. Consequently, we gave the highest possible rating for this criterion.
4. Pre-registration (2.5 stars):
In summary, the authors pre-registered the study, but there were some deviations from this pre-registration, as well as a set of analyses (that formed the main focus of the discussion and conclusions for this study) that were not mentioned in the pre-registration.
In the body of the paper, the “identity threat composite” score was calculated differently to how it had been planned in the pre-registration, but this deviation was acknowledged in a footnote, and the pre-registered version of the score was still calculated in the supplementary materials.
However, there were also deviations that were not acknowledged in the paper:
- In the paper, perceptions of company sincerity were measured by averaging two items together: “To what extent do you think Harrison Technologies is sincerely interested in increasing gender diversity in their workforce?” and “How believable is Harrison Technologies’ interest in increasing gender diversity in their workforce?”
- In the pre-registration, the plan had been to average the response to three questions instead of two (the third one being: “How committed do you think the company is to increasing gender diversity in their workforce?”) but this was not mentioned in the body of the paper.
- In the paper, multicategorical conditional process analysis was the main analysis method chosen and reported upon for Study 3; their findings formed the basis of the discussion and conclusions for this study.
- In the pre-registration, however, multicategorical conditional process analysis was not mentioned in either the main analysis section nor the exploratory analysis section.
- In the pre-registration, the “main analyses” that had been planned had been a series of repeated measures two-way ANOVAs. These were replaced with conditional process analysis in the final paper, but the fact that this decision was made was not explicitly mentioned or explained in the paper.
- The manipulation check that was reported upon in the paper was listed as one of these two-way ANOVAs. However, they had also listed the following point about their ANOVAs in their pre-registration (but did not report acting on this in their paper):
- “If our data are non-normally distributed, we will conduct either a square-root, logarithmic, or inverse transformation—depending on the severity of the non-normality. If these transformations do not improve normality, we will use equivalent tests that do not require data to be normally distributed.”
- The manipulation check that was reported upon in the paper was listed as one of these two-way ANOVAs. However, they had also listed the following point about their ANOVAs in their pre-registration (but did not report acting on this in their paper):
Explanations of statistical terms
The analysis conducted in the paper was a multicategorical conditional process analysis. This glossary is designed to help you navigate the explanations in the event that there are any terms that are unfamiliar to you.
Glossary of terms
Please skip this section if you are already familiar with the terms, and if this is the first time you are reading about any of these concepts, please note that the definitions given are (sometimes over-)simplifications.
- Independent variable (a.k.a. predictor variable): a variable in an experiment or study that is altered or measured, and which affects other (dependent) variables. [In many studies, including this one, we don’t know whether an independent variable is actually influencing the dependent variables, so calling it a “predictor” variable may not be warranted, but many models implicitly assume that this is the case. The term “predictor” variable is used here because it may be more familiar to readers.]
- Dependent variable (a.k.a. outcome variable): a variable that is influenced by an independent variable. [In many studies, including this one, we don’t know whether a dependent variable is actually being causally influenced by the independent variables, but many models implicitly assume that this is the case.]
- Null Hypothesis: in studies investigating the possibility of a relationship between given pairs/sets of variables, the Null Hypothesis assumes that there is no relationship between those variables.
- P-values: the p-value of a result quantifies the probability that a result at least as extreme as that result would have been observed if the Null Hypothesis were true. All p-values fall in the range (0, 1].
- Statistical significance: by convention, a result is deemed to be statistically significant if the p-value is below 0.05, meaning that there is a 5% chance that a result at least as extreme as that result would have occurred if the Null Hypothesis were true.
- The more statistical tests conducted in a particular study, the more likely it is that some results will be statistically significant due to chance. So, when multiple statistical tests are performed in the same study, many argue that one should correct for multiple comparisons.
- Statistical significance also does not necessarily translate into real-world/clinical/practical significance – to evaluate that, you need to know about the effect size as well.
- Linear regression: this is a process for predicting levels of a dependent/outcome variable (often called a y variable) based on different levels of an independent/predictor variable (often called an x variable), using an equation of the form y = mx + c (where m is the rate at which the dependent/outcome variable changes as a function of changes in the independent/predictor variable, and c describes the level of the dependent variable that would be expected if the independent/predictor variable, x, was set to a level of 0).
- Mediator variable: a variable which (at least partly) explains the relationship between a predictor variable and an outcome variable. [Definitions of moderation vary, but Andrew Hayes defines it as occurring any time when an indirect effect – i.e., the effect of a predictor variable on the outcome variable via the mediator variable, is statistically significantly different from zero.]
- Moderator variable: a variable which changes the strength or direction of a relationship between a predictor variable and an outcome variable.
- Categorical variables: these are variables described in terms of categories (as opposed to being described in terms of a continuous scale).
- Reference category for multicategorical x variables in regressions: this is the category against which the effects of other categories are compared. The reference category is not included as one of the predictor variables – instead, all the other categories are included as predictor variables (and their effects are compared against the one that is left out).
- In order to model the effects of a categorical variable on an outcome variable, you need to have something to compare the categorical variable to. When there are only two, mutually-exclusive categories (i.e., when you are working with a dichotomous predictor variable), this is relatively easy – you just model the effects of one category in comparison to the absence of that category (which equates to comparing one category to the other). The category you are comparing to is called the reference category. If you want to model the effects of the variable you used as the reference category, you just switch the variables around so that the other variable is the reference category.
- For categorical variables with more than two categories (e.g., let’s say you have three categories, called I, II, and III), you end up needing to do multiple regressions before you can quantify the effects of all of the variables in comparison to all the others. You first choose one category as the reference or comparison category (e.g., variable I), then you can quantify the effects of the others (in comparison to that reference category; e.g., quantify the effects of variables II and III in comparison to variable I). In order to quantify all the effects of all the variables, you then need to switch the variables around so that you’re also running regressions with each other variable (in turn) as the reference category (e.g., quantifying the effects of variables I and III with variable II as the reference category, then quantifying the effects of variables I and II with variable III as the reference category).
Additional Information about the Results
Figures 8 and 9 from the original study described in sentences
Here is a list of the original study’s significant results in Figure 8 above, but this time in word format:
- If we use a linear regression to predict perceived sincerity (the y variable) using three categorical x variables (all with authentic diversity set as the reference category) – aspirational diversity, authentic non-diversity, and counterfeit diversity – then…
- …the coefficient of the aspirational diversity (versus authentic diversity) contrast is statistically significantly different from 0 (p <0.001), at a value of -0.74.
- …the coefficient of the authentic non-diversity (versus authentic diversity) contrast is statistically significantly different from 0 (p <0.001), at a value of -1.56.
- …the coefficient of the counterfeit diversity (versus authentic diversity) contrast is statistically significantly different from 0 (p <0.001), at a value of -1.30.
- If we use a linear regression to predict perceived sincerity (the y variable) using three categorical x variables (all with aspirational diversity set as the reference category) – authentic diversity, authentic non-diversity, and counterfeit diversity – then…
- …the coefficient of the authentic non-diversity (versus aspirational diversity) contrast is statistically significantly different from 0 (p <0.001), at a value of -0.82.
- …the coefficient of the counterfeit diversity (versus aspirational diversity) contrast is statistically significantly different from 0 (p <0.001), at a value of -0.56.
- If we use a linear regression to predict perceived sincerity (the y variable) using three categorical x variables (all with counterfeit diversity set as the reference category) – aspirational diversity, authentic non-diversity, and authentic diversity – then…
- …the coefficient of the authentic non-diversity (versus aspirational diversity) contrast is statistically significantly different from 0 (p <0.05), at a value of -0.26.
- If we use a linear regression to predict identity threat concerns (the y variable) using perceived sincerity as one of the predictors, gender as another predictor, the interaction between gender and sincerity as another predictor, and three categorical x variables (all with authentic diversity set as the reference category) – aspirational diversity, authentic non-diversity, and counterfeit diversity – as categorical predictors, then…
- ……the coefficient of the aspirational diversity (versus authentic diversity) contrast is statistically significantly different from 0 (p <0.001), at a value of 0.45.
- ….the coefficient of gender (with female gender coded as 1) is statistically significantly different from 0 (p <0.001), at a value of -2.09.
- ….the coefficient of the gender by sincerity interaction is statistically significantly different from 0 (p <0.001), at a value of -0.51.
- If we use a linear regression to predict identity threat concerns (the y variable) using perceived sincerity as one of the predictors, gender as another predictor, the interaction between gender and sincerity as another predictor, and three categorical x variables (all with aspirational diversity set as the reference category) – authentic diversity, authentic non-diversity, and counterfeit diversity – as categorical predictors, then…
- …the coefficient of the authentic non-diversity (versus aspirational diversity) contrast is statistically significantly different from 0 (p <0.05), at a value of -0.27.
- …the coefficient of the counterfeit diversity (versus aspirational diversity) contrast is statistically significantly different from 0 (p <0.01), at a value of -0.32.
Here is a list of the original study’s significant results in Figure 9 above, but this time in word format:
- If we use a linear regression to predict perceived sincerity (the y variable) using three categorical x variables (all with authentic diversity set as the reference category) – aspirational diversity, authentic non-diversity, and counterfeit diversity – and using baseline interest level as a covariate – then…
- …the coefficient of the aspirational diversity (versus authentic diversity) contrast is statistically significantly different from 0 (p <0.001), at a value of -0.77.
- …the coefficient of the authentic non-diversity (versus authentic diversity) contrast is statistically significantly different from 0 (p <0.001), at a value of -1.57.
- …the coefficient of the counterfeit diversity (versus authentic diversity) contrast is statistically significantly different from 0 (p <0.001), at a value of -1.32.
- If we use a linear regression to predict perceived sincerity (the y variable) using three categorical x variables (all with aspirational diversity set as the reference category) – authentic diversity, authentic non-diversity, and counterfeit diversity – then…
- …the coefficient of the authentic non-diversity (versus aspirational diversity) contrast is statistically significantly different from 0 (p <0.001), at a value of -0.80.
- …the coefficient of the counterfeit diversity (versus aspirational diversity) contrast is statistically significantly different from 0 (p <0.001), at a value of -0.55.
- If we use a linear regression to predict perceived sincerity (the y variable) using three categorical x variables (all with counterfeit diversity set as the reference category) – aspirational diversity, authentic non-diversity, and authentic diversity – then…
- …the coefficient of the authentic non-diversity (versus aspirational diversity) contrast is statistically significantly different from 0 (p <0.05), at a value of -0.24.
- If we use a linear regression to predict company interest (the y variable) using perceived sincerity as one of the predictors, gender as another predictor, the interaction between gender and sincerity as another predictor, and three categorical x variables (all with authentic diversity set as the reference category) – aspirational diversity, authentic non-diversity, and counterfeit diversity – as categorical predictors, and using baseline interest level as a covariate, then…
- …the coefficient of perceived sincerity is statistically significantly different from 0 (p <0.001), at a value of 0.25.
- ….the coefficient of gender (with female gender coded as 1) is statistically significantly different from 0 (p <0.01), at a value of -0.61.
- ….the coefficient of the gender by sincerity interaction is statistically significantly different from 0 (p <0.05), at a value of 0.17.
How we defined the “percentage of findings that replicated” in this study
Our current policy for calculating the percentage of findings that replicate in a given study is as follows. (This policy may change over time, but the policy below is what applied when we replicated this particular study.)
- We currently limit ourselves to the findings that are reported upon in the body of a paper. (In other words, we do not base our calculations on supplementary or other findings that aren’t recorded in the body of the paper.)
- Within the findings in the paper, we select the ones that were presented by the authors as being key results of the study that we are replicating.
- If there is a key results table or figure, we include that in the set of main results to consider.
- If a manipulation check is included in the study results, we also conduct that, but we do not count toward the denominator of “total number of findings” when calculating the percentage of findings that replicate.
- We pre-register the set of hypotheses that we consider to be the “main” ones we are testing.
- Within the set of findings that we focus on, we only count the ones that were reported to be statistically significant in the original paper. That is, we do not count a null result in the original paper as a finding that contributes to the denominator (when calculating the percentage that replicate).
In this paper, we were focusing on Study 3, and the main findings for that study (as presented in the body of the paper) are shown in Figures 8 and 9. Other findings are also recorded, but these related to the manipulation check and so were only pre-registered as secondary analyses and were not the main focus of our analyses (nor did they contribute to the denominator when calculating the percentage of findings that replicated).
Within Figures 8 and 9, we focused on paths a and b, plus the gender-related interaction terms, as these were most relevant to the authors’ hypotheses. However, we did not count non-significant findings in the original study and instead focused on the significant findings among the a and b paths and gender effects. There were a total of 17 significant results (along the a and b paths and gender effects, across Figures 8 to 9).
A possible problem with how we’re calculating the replication rate in this paper
We are continuing to follow our pre-registered plan, but it seems worth highlighting a potential problem with this in the case of this particular study (also noted in the body of our write-up). According to the textbook that the authors cite (and that forms the main source of information on this analysis method):
“You absolutely should focus on the signs of a and b when talking about the indirect effect. Just don’t worry so much about p-values for these, because you care about ab, not a and b.”
Depending on how one interprets this, it may be that the supplementary tables of indirect effects and indices of moderated mediation would have been well-placed in the main body of the paper (with Figures 8 and 9 being potentially relegated to the supplementary materials if needed).
We may have done some things differently if we weren’t aiming for an exact replication of findings reported in the body of the paper
As noted above, we should probably have reported on the main results differently and would have relegated Figures 8 and 9 to the supplementary materials. In addition, we probably would not have done the ANOVAs given the non-normally distributed data we observed (unless we had done some kind of transformation of the data first).
Conditional process analysis results in more detail
Reproduction of Figure 8 – with commentary
Below is Figure 8 from the original paper, with our findings written in dark green and red font alongside the original findings.
There are a few different ways to quantify the replication rate of the findings in this paper. As explained above, we have chosen to focus on the findings in the diagram that were most relevant to the original authors’ hypotheses and that were significant in the original paper. This translated into counting the significant findings in the diagram except for the c’ paths (which were not as relevant to the hypotheses the authors were investigating, given that they were using Hayes’ conditional process analysis to investigate them – Hayes explicitly states in his textbook that mediation can be said to be occurring even if the c’ path is significant). Of the eight significant results (excluding the c’ paths) in this diagram, seven of them replicated in our study (87.5%). Here are some of the other ways we could quantify the replication rate:
- Out of the 15 numbers here, the number that successfully replicated (in the sense that our result matched the direction and significance [or non-significance] of their original finding) was 13 (~87%). (There was one finding they had that was significant which didn’t replicate, and one finding they had that was non-significant which was significant in ours – these are shown as dark red numbers in the image below.)
- If we ignore the b path (which was non-significant in the first instance and then significant in our replication), of the 14 remaining numbers in the diagram, 13 of them replicated (~93%).
Reproduction of Figure 9 – with commentary
Below is Figure 9 from the original paper, with our findings written in dark green and red font alongside the original findings. Of the nine significant results (excluding the c’ paths) in this diagram, six of them replicated in our study (66.7%). The differences in findings were as follows:
- In our study, it appears the effects of counterfeit diversity and authentic non-diversity were very similar to each other (whereas in the original, authentic non-diversity had appeared to be perceived as less sincerely interested in increasing gender diversity than counterfeit diversity).
- We found no evidence of gender influencing company interest or interacting with perceived sincerity.
Here is another way we could quantify the replication rate:
- Out of the 15 numbers here (including the c’ paths), the number that successfully replicated (in the sense that our result matched the direction and significance [or non-significance] of their original finding) was 12 (80%).
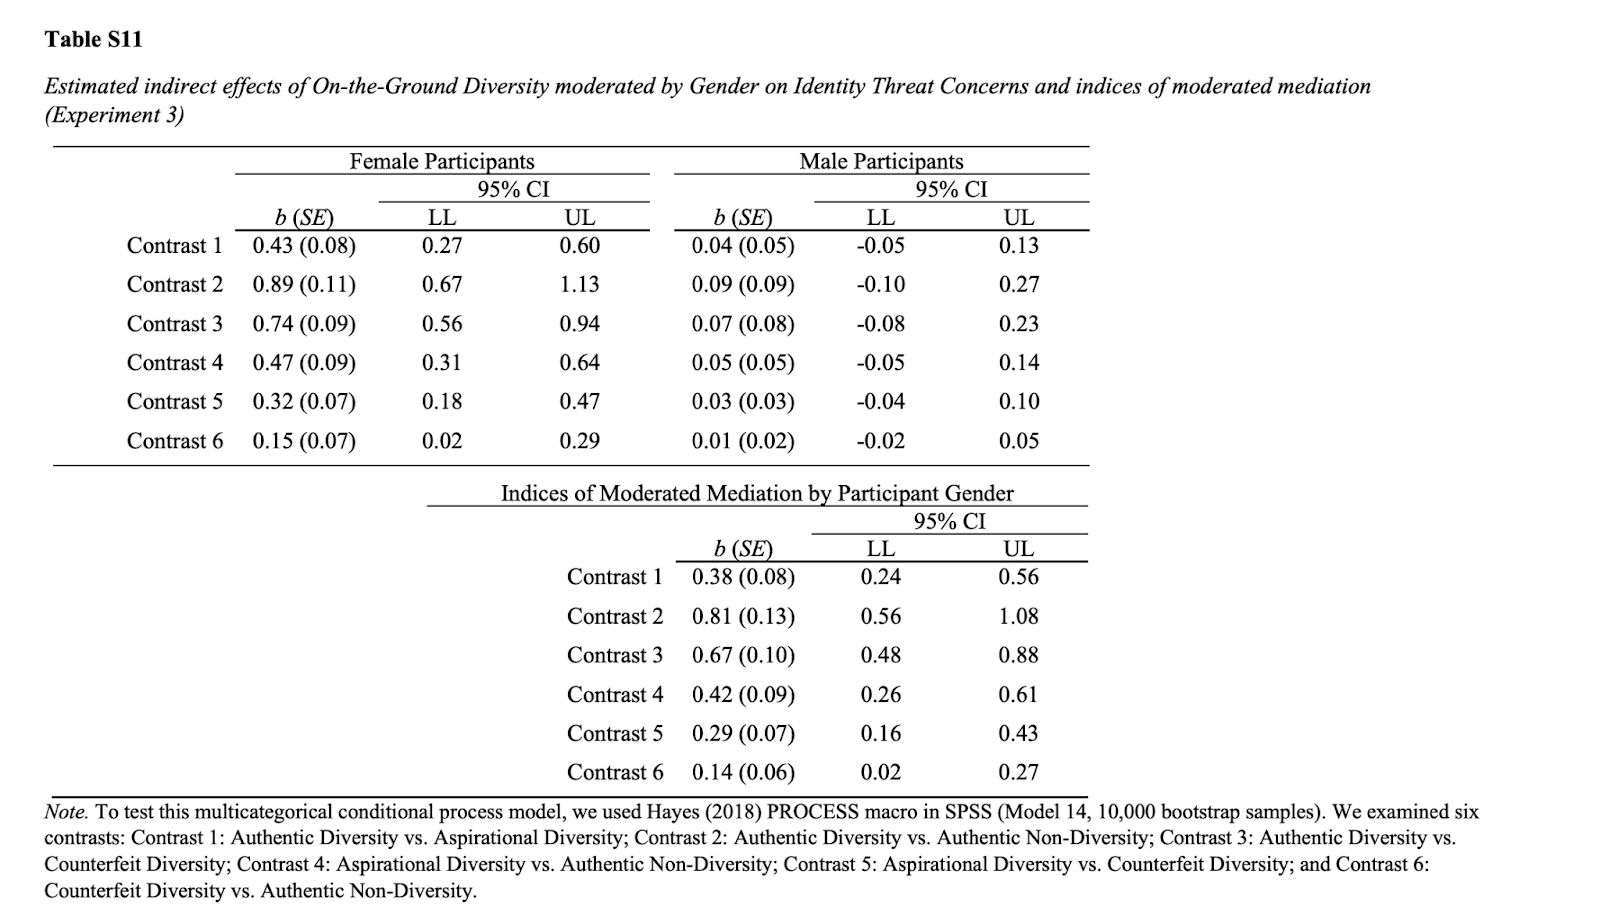
Reproduction of Supplementary Table S11
Indirect effects: Diversity condition -> xSincerity -> xThreatBasedConcerns
Unlike the original study, we found no significant indirect effects of authentic non-diversity (compared to counterfeit diversity) on identity threat concerns via perceived sincerity. Other findings, however, were successfully replicated in our study.
Indirect effects for female participants – from the original study and our replication
In the table below, findings that we replicated are displayed in green font, and the finding that we did not replicate is displayed in dark red font.
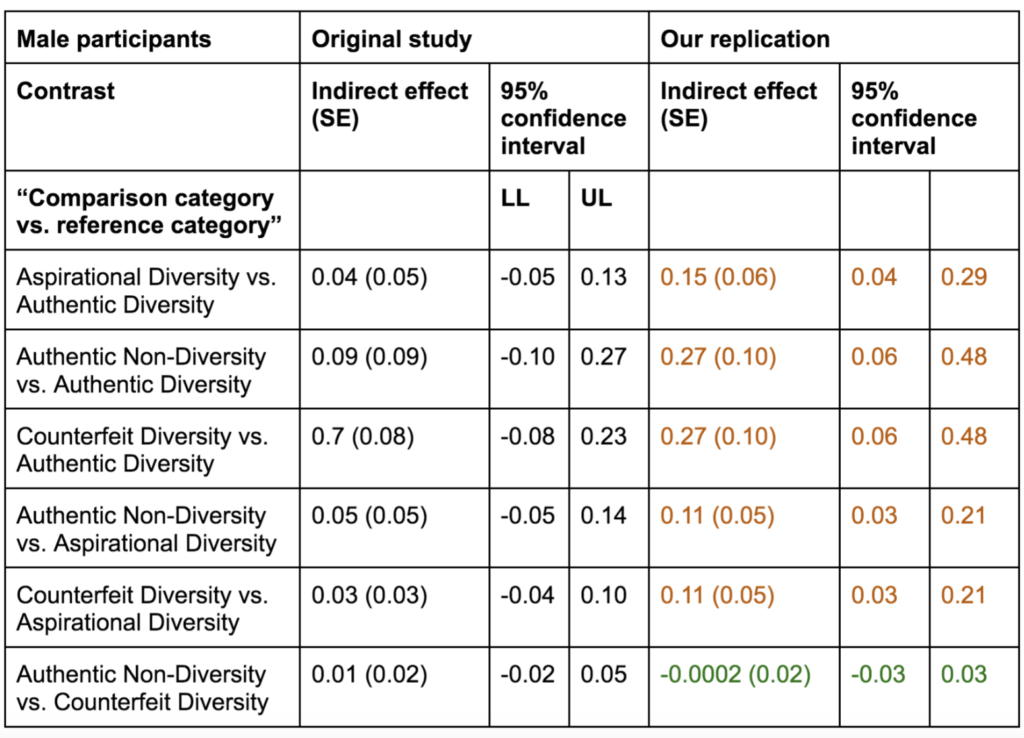
Indirect effects for male participants – from the original study and our replication
In the table below, the (null) finding that we replicated is displayed in green font, and the findings that were non-significant in the original study, but significant in our study, are displayed in dark orange font.
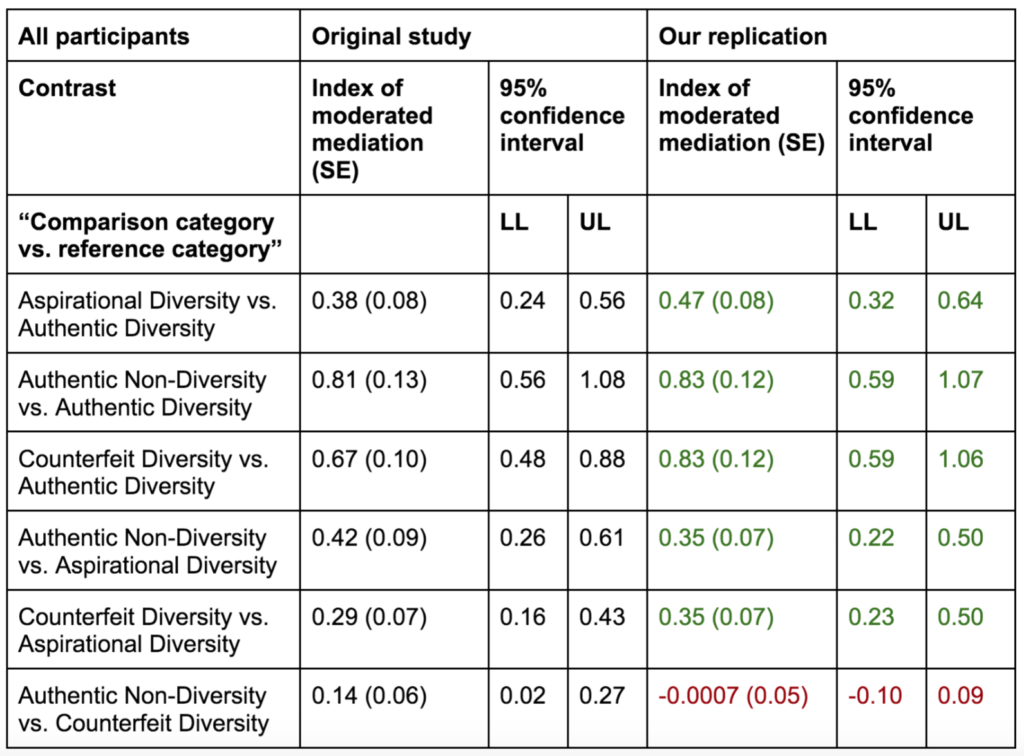
Index of moderated mediation
Unlike the original study, we found that gender did not appear to significantly moderate the indirect effects of authentic non-diversity (compared to counterfeit diversity) on identity threat concerns via perceived sincerity (which is unsurprising, given these indirect effects weren’t significant in the first place, as shown in the previous table). That non-replicated finding is displayed in dark red font. Other findings, however (shown in green font), were successfully replicated in our study.
For comparison: Original S11
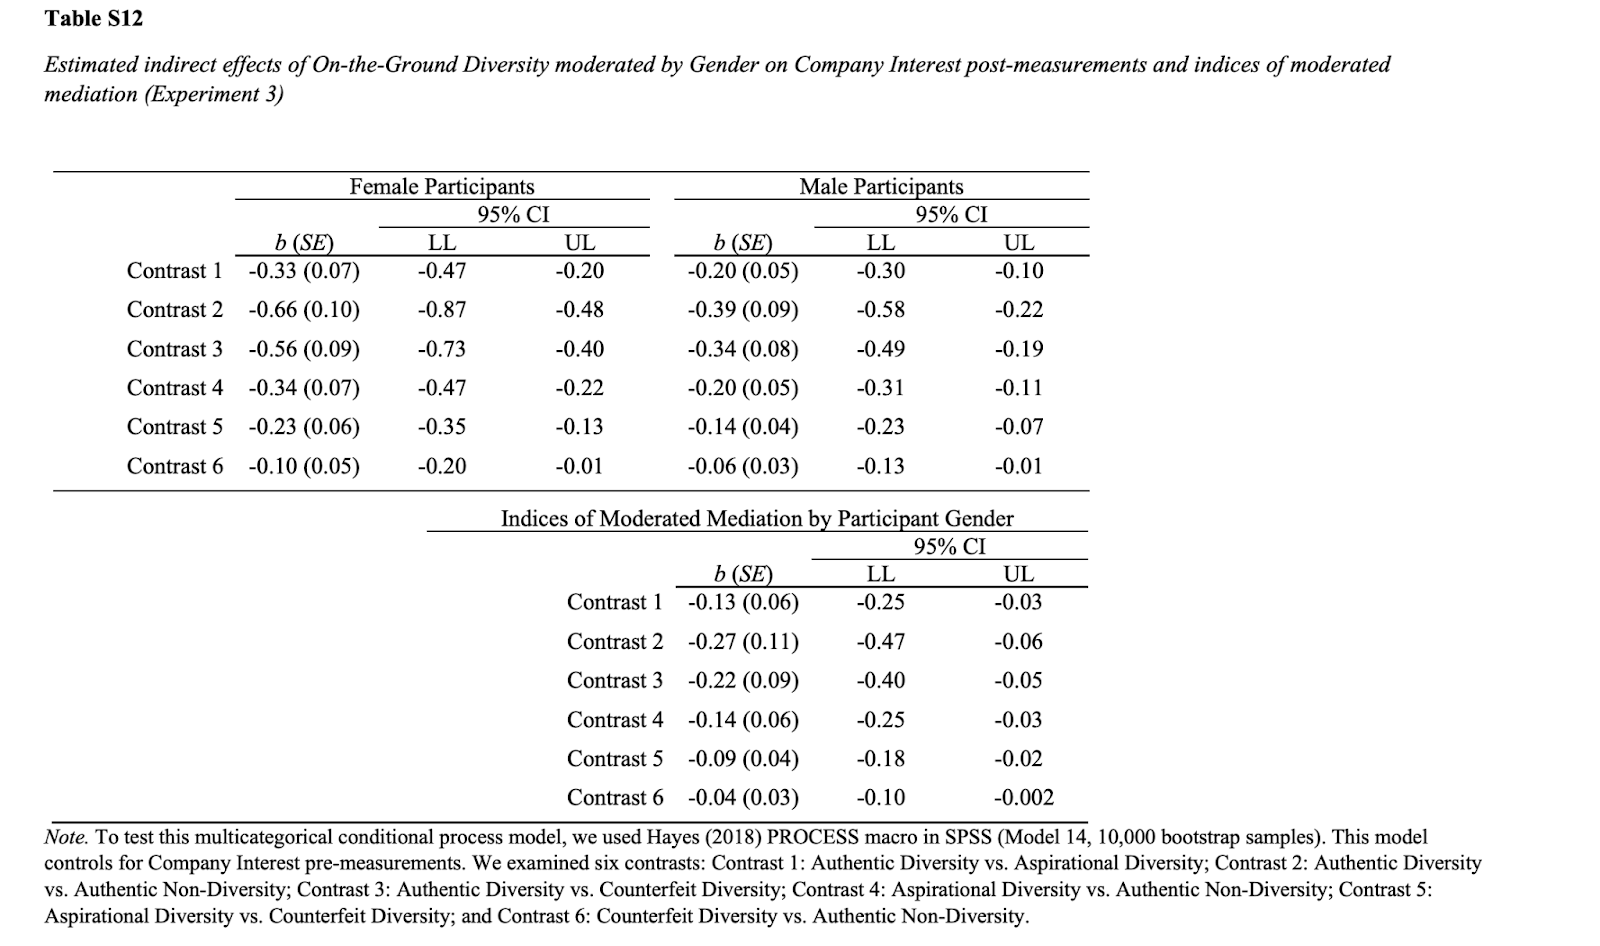
Reproduction of Supplementary Table S12
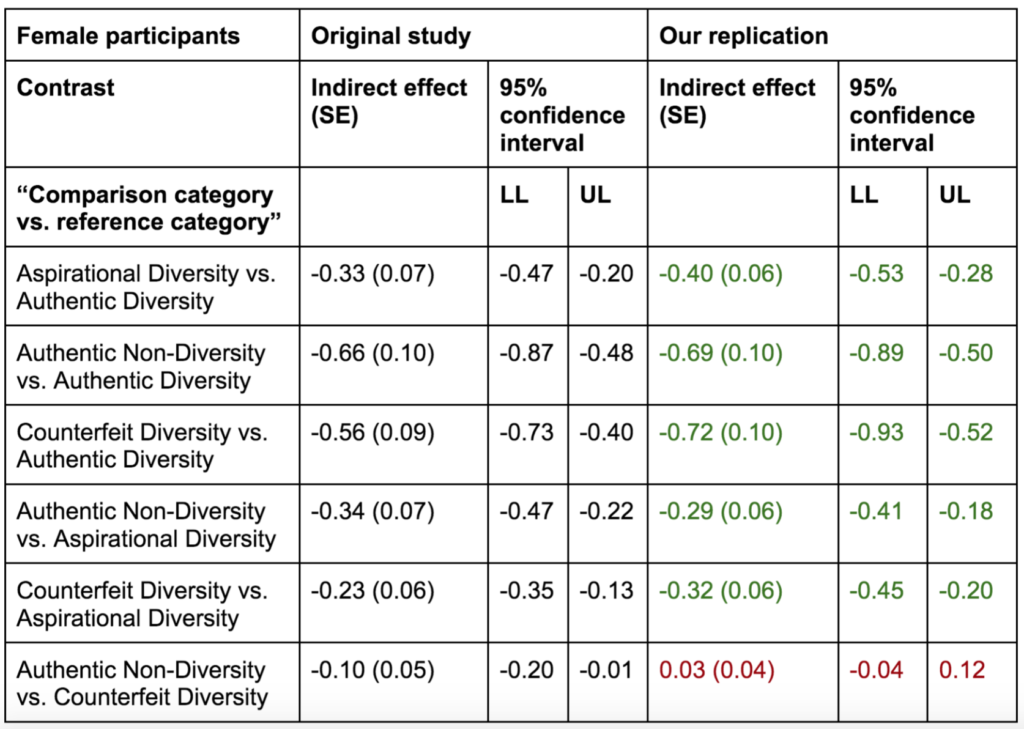
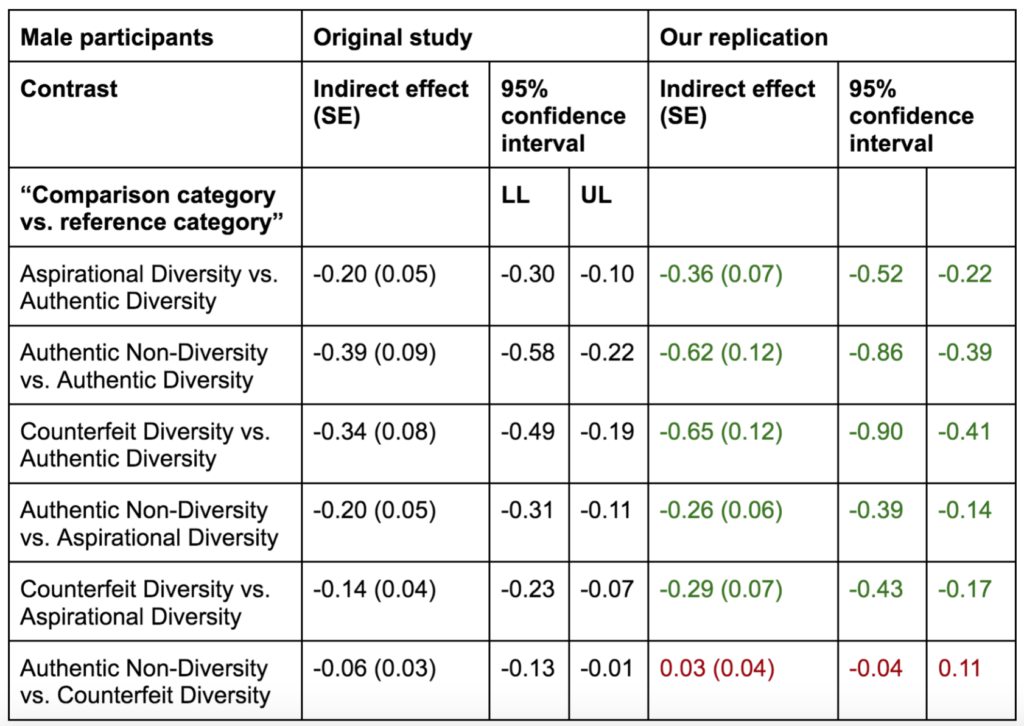
Indirect effects: Diversity condition -> xSincerity -> Interest_T2
Unlike the original study, we found no significant indirect effects of authentic non-diversity (compared to counterfeit diversity) on company interest via perceived sincerity. Other findings, however, were successfully replicated in our study.
Indirect effects for female participants – from the original study and our replication
Indirect effects for male participants – from the original study and our replication
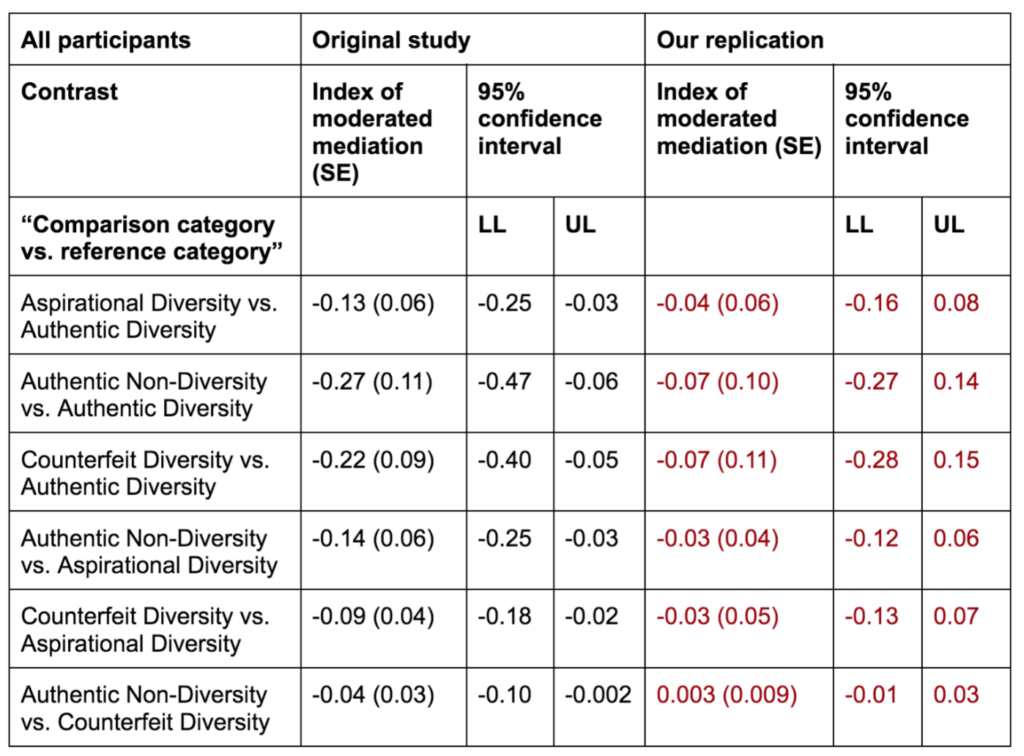
Index of moderated mediation
Unlike the original study, we found no evidence of gender moderating the indirect effects of diversity condition on company interest via sincerity perceptions (i.e., men and women did not differ in the degree to which the impact of diversity condition on company interest was mediated by perceived sincerity – the index of moderated mediation was not different from zero).
For comparison: Original S12
Manipulation check details
As per our pre-registered plan, a two-way analysis of variance (ANOVA) was performed to assess the effects of diversity condition and time point on diversity expectations. This was performed in Jasp (which is worth noting as there may be different results in Jasp versus SPSS: Jasp runs on R code, and ANOVAs have been observed to return different results in R versus SPSS, at least in previous years).
Note that the data are kurtotic in both the original data set (-1.25) and in our replication (-1.27). The study authors had originally planned to do a transformation on the dataset if this occurred, but they did not report having done so in their paper. We aimed to replicate their methods exactly, and had pre-registered our intention to do this manipulation check in the way outlined above, so we did not perform a transformation on the dataset either.
We found that the kurtosis of the diversityExpectation variable (with time point 1 and time point 2 pooled) was -1.25 (standard error: 0.15) for the original dataset. This was also evident on visual inspection of the original diversityExpectation data (pooled across time points 1 and 2), which is clearly not normally distributed, as shown below. (Confirming our visual observations, the Shapiro-Wilk test was significant (9.02E-23).)
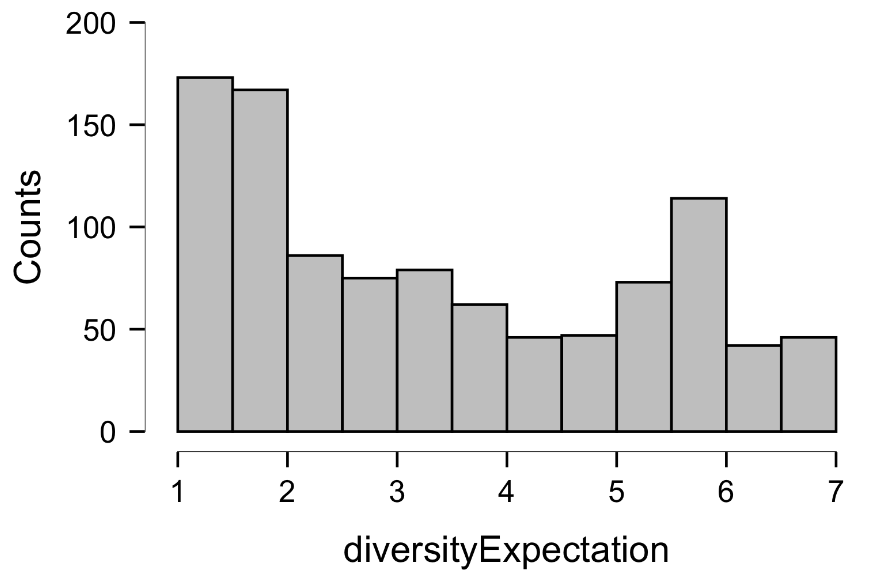
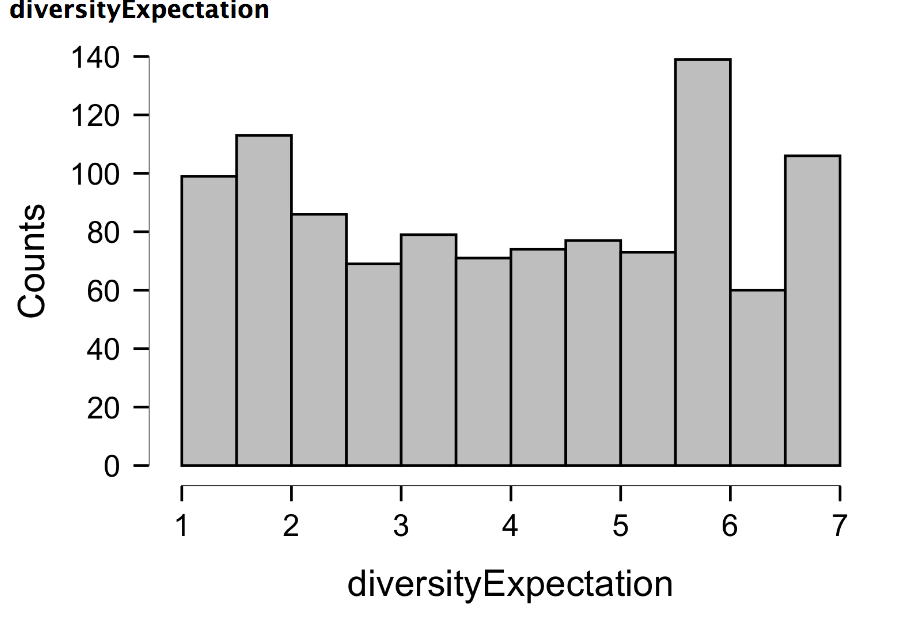
Similar to the original data, our diversityExpectation data was also kurtotic (kurtosis -1.27 [standard error: 0.15]). However, we still employed this method because (1) this is what we pre-registered and (2) we were aiming to replicate the methods of the original study exactly.
Like in the original study, the results were significant (i.e., were consistent with the manipulation check having worked). More specifically, in a repeated measures ANOVA, with diversity condition and gender as between-subjects factors and diversityExpectation as the repeated-measures factor, there were statistically significant main effects of time (F(1,515) = 784.39, p = 1.44E-105) and diversity condition (F(3,515) = 357.78, p = 3.06E-129), as well as a significant interaction between time and diversity condition (F(3,515) = 299.72, p = 1.57E-112).
Additional Analyses
The first two analyses discussed below were also included in the body of the text, but are included again here for those who want to review all the additional, non-replication-related analyses in one place.
Pre-registered additional analyses
Correlation between “perceived sincerity” and identity threat among women
As additional analyses outside of our replication, we also showed that, among women, “perceived sincerity” (with respect to interest in increasing gender diversity) was statistically significantly negatively correlated with identity threat concerns (Pearson’s r = -0.65, p = 1.78E-32). (This was also the case for men, but we did not pre-register this, and the identity threat concerns among men were lower across all conditions than they were for women.)
Correlation between “perceived sincerity” and company interest
We also found that there was a statistically significant positive correlation between “perceived sincerity” (with respect to interest in increasing gender diversity) and interest in working for the company at the second time point, for both men (Pearson’s r = 0.51 , p = 1.4E-18) and women (Pearson’s r = 0.57, p = 7.2E-24).
Comment on correlations
One might argue that including the correlations above could have served to highlight some of the conclusions described in the paper, but in a way that would have been more accessible and intuitive for a wider range of audiences to understand. However, these simpler analyses don’t show that “perceived sincerity” was mediating the relationship between experimental conditions and the two main outcome variables, so it would have been insufficient on its own in demonstrating the findings from this paper.
Exploratory additional analyses
As we mentioned in our pre-registration, we also planned to conduct exploratory analyses. Our exploratory analyses are reported upon below. For anyone reading this, if you have any suggestions for additional exploratory analyses for us to run, please let us know.
For a company with a 3:1 male:female staff ratio, it probably doesn’t actually harm “perceived sincerity” to misrepresent gender diversity in company ads (compared to showing ads with 3:1 ratio and saying nothing about it), but it would be even better to show ads with a 3:1 ratio and to follow up with a statement about diversity (as in the “aspirational diversity” condition in this experiment)
Comparing “perceived sincerity” between counterfeit diversity and authentic non-diversity
You might ask, if your company has a 3:1 ratio of men to women, is it worse (in terms of the “perceived sincerity” outcome of this experiment) to present your ads with a 50:50 gender split, compared to just showing ads with a 3:1 ratio (i.e., is it worse to make it look like you’re more diverse than you are, rather than just showing things as they are, if your goal is to convince the audience that you are sincerely interested in increasing gender diversity in your workplace)? The answer appears to be no, at least according to this Mann-Whitney U test (which we performed instead of a student’s t-test as data were non-normally distributed). The mean “perceived sincerity” in the counterfeit diversity condition (2.22) was no different to the mean in the authentically non-diverse condition (2.22; Mann-Whitney U = 8380, n1 = 143, n2 = 119, p = 0.83).
Comparing “perceived sincerity” between counterfeit diversity and aspirational diversity
You might ask, if your company has a 3:1 ratio of men to women, can you get better results (in terms of the “perceived sincerity” outcome of this experiment) by showing ads with a 3:1 ratio if you also include a statement about the importance of increasing gender diversity, compared to if you showed ads with 50:50 split without addressing the gender ratio? In other words, if your goal is to convince the audience that you are sincerely interested in increasing gender diversity in your workplace, would you be better off presenting things as they are plus writing a statement about your intentions to improve gender diversity (as opposed to being better off presenting ads with a 50:50 gender split)? The answer here appears to be yes – it seems to be better to present things as they are while highlighting how important it is to the company executives to improve the company’s gender diversity (at least compared to simply showing a 50:50 image split without any accompanying statement about diversity). The mean “perceived sincerity” for the aspirational diversity condition (3.04) was significantly greater than the mean for the counterfeit diversity condition (2.22; Mann-Whitney U = 11369, n1 = 107, n2 = 143, p = 1.78E-11).
Comments on “perceived sincerity” in the conditions above
Taking the above two results together, if someone was trying to design promotional materials for a tech company with a 3:1 male:female staff ratio, and if their goal was to convince their audience that their workplace was sincerely interested in increasing gender diversity, they would be better off including images with a 50:50 split than doing nothing, but an even better option (with respect to their stated goal) would be to include a realistic 3:1 split in the images but to also present the audience with a statement from company executives explaining that they recognize a problem and that they aspire to increase gender diversity.
For companies with a 3:1 male:female staff ratio, it probably doesn’t cause more identity threat concerns among women if they misrepresent gender diversity in company ads – there are likely going to be similar levels of identity threat concerns in that scenario compared to the other two tested presentations in this experiment
Comparing identity threat concerns between counterfeit diversity and authentic non-diversity – for women participants
You might ask, if your company has a 3:1 ratio of men to women, is it worse (in terms of the identity threats reported by women in this experiment after day 1 at work) to present your ads with a 50:50 gender split, compared to just showing ads with a 3:1 ratio? In other words, is it worse to make it look like you’re more diverse than you are, rather than just showing things as they are, if your goal is to minimize identity threat concerns experienced by women after day 1 at your workplace? The answer appears to be no. The mean level of identity threat concerns reported by women in the counterfeit diversity condition (2.75) was no different to the mean in the authentically non-diverse condition (2.74; Mann-Whitney U = 2279, n1 = 71, n2 = 65, p = 0.96).
Comparing identity threat concerns between counterfeit diversity and aspirational diversity – for women participants
You might ask, if your company has a 3:1 ratio of men to women, can you get better results (i.e., fewer identity threats reported by women in this experiment after day 1 at work) by showing ads with a 3:1 ratio if you also include a statement about the importance of increasing gender diversity, compared to if you showed ads with 50:50 split without addressing the gender ratio? In other words, if your goal is to minimize identity threat concerns experienced by women working at your organization after their first day of work, would you be better off presenting things as they are plus writing a statement about your intentions to improve gender diversity (as opposed to being better off presenting ads with a 50:50 gender split)? The answer is probably no. The mean level of identity threat concerns reported by women in the aspirational diversity condition (2.63) was not significantly smaller than the mean in the counterfeit diversity condition (2.75; Mann-Whitney U = 1525, n1 = 47, n2 = 71, p = 0.43).
Comments on identity threat concerns among women in the conditions above
Taking the above two results together, if someone was trying to design promotional materials for a tech company with a 3:1 male:female staff ratio, and if their goal was to minimize the extent to which new women employees experienced identity threat concerns, neither of the attempted approaches explored in this experiment (presenting 50:50 gender split and presenting a 3:1 split but including a company statement about the importance of gender diversity) appear to be helpful in reducing identity threat concerns.
Comparing company interest between counterfeit diversity and authentic non-diversity – for all participants
You might ask, if your company has a 3:1 ratio of men to women, is it worse (in terms of the level of interest that people have in continuing to work for your organization after day 1) to present your ads with a 50:50 gender split, compared to just showing ads with a 3:1 ratio? In other words, is it worse to make it look like you’re more diverse than you are, rather than just showing things as they are, if your goal is to have people interested in continuing to work for you after day 1 of work? The answer appears to be no. The mean level of interest at time point 2 in the counterfeit diversity condition (3.51) was not significantly higher than the mean in the authentically non-diverse condition (3.40; Mann-Whitney U = 7989.5, n1 = 143, n2 = 119, p = 0.38).
Comparing company interest between aspirational diversity and counterfeit diversity – for all participants
You might ask, if your company has a 3:1 ratio of men to women, can you get better results (in terms of the level of interest that people have in continuing to work for your organization after day 1) by showing ads with a 3:1 ratio if you also include a statement about the importance of increasing gender diversity, compared to if you showed ads with 50:50 split without addressing the gender ratio? In other words, if your goal is to maximize the level of interest that people have in continuing to work for your organization after day 1, would you be better off presenting things as they are plus writing a statement about your intentions to improve gender diversity (as opposed to being better off presenting ads with a 50:50 gender split)? The answer looks like a no (although there was a trend toward a yes). The mean level of interest in the aspirational diversity condition (3.75) was not statistically significantly greater than the mean in the counterfeit diversity condition (3.51; Mann-Whitney U = 8605.5, n1 = 107, n2 = 143, p = 0.07).
Comments on identity threat concerns among women in the conditions above
Taking these results together, it appears that a company with a 3:1 ratio of men to women won’t be able to significantly increase the interest people have in continuing to work there simply by creating ads with a 50:50 gender split or by having a statement about the importance of improving gender diversity in their workplace (although the latter showed a non-significant trend toward being useful).
A condition not included in the experiment
Something that has not been addressed by this experiment is the possible effects of presenting ads (for non-diverse companies) with a 50:50 gender split, in addition to a statement by company executives about how the company is actually not where they want to be in terms of gender balance and about how much the company executives prioritize the goal of increasing the company’s gender diversity. It would be interesting to see if it would be helpful (in terms of identity threat concerns and in terms of company interest) to show a 50:50 gender split in company ads, then to also show a statement about the company’s commitment to improving the actual gender diversity among their staff (similar to the “aspirational diversity” condition, except in this case preceded by ads with a 50:50 gender split).
References
Hayes, A. F. (2022). Introduction to mediation, moderation, and conditional process analysis a regression-based approach (Third edition.). The Guilford Press.
Kroeper, K. M., Williams, H. E., & Murphy, M. C. (2022). Counterfeit diversity: How strategically misrepresenting gender diversity dampens organizations’ perceived sincerity and elevates women’s identity threat concerns. Journal of Personality and Social Psychology, 122(3), 399-426. https://doi.org/10.1037/pspi0000348
