Executive Summary
| Transparency | Replicability | Clarity |
|---|---|---|
We ran a replication of study 2A from this paper, which tested whether knowing additional information about another person changed what participants thought the other person would know about them. The primary result in the original study failed to replicate. There was no relationship between whether participants were given information about their ‘partner’ and how likely the participants thought their ‘partner’ would be to detect a lie the participant told.
Full Report
Study Diagram

Replication Conducted
We ran a replication of Study 2A from: Shah, A.K., & LaForest, M. (2022). Knowledge about others reduces one’s own sense of anonymity. Nature, 603, 297–301. https://doi.org/10.1038/s41586-022-04452-3
How to cite this replication report: Transparent Replications, & Metskas, A. (2022). Report #3: Replication of a study from “Knowledge about others reduces one’s own sense of anonymity” (Nature | Shah & LaForest 2022). Clearer Thinking. https://replications.clearerthinking.org/replication-2022nature603
(Report DOI: https://doi.org/10.5281/zenodo.17716241)
Key Links
- The data collected in the replication study is available for download as a .csv file.
- The experimental materials can be previewed on GuidedTrack.
- The experiment code is available to view or copy on GuidedTrack (free login required).
- Download a PDF of the JASP Output
- Primary Analyses – N = 475 Entire Sample
- Secondary Analyses – N = 270 Manipulation Check Passed Subsample
- Additional Analyses – N = 430 Comprehension Check Passed Subsample
- Additional Analyses – N = 244 Man. & Comp. Checks Both Passed Subsample
- Our Preregistration is available at AsPredicted.
- Manifold Markets predicted a 62% probability of this study replicating.
- Metaculus predicted a 69% probability of this study replicating.
- Download a PDF of Shah & LaForest’s original paper.
- The supporting materials for the original paper can be found on OSF.
Overall Ratings
To what degree was the original study transparent, replicable, and clear?
| Transparency: how transparent was the original study? |  Between information provided on OSF and responsive communication from the authors, it was easy to conduct a replication of this study; however, the authors did not pre-register the 9 laboratory experiments in this paper. |
| Replicability: to what extent were we able to replicate the findings of the original study? | The main finding did not replicate. Participants having information about another person did not increase belief by the participants that the other person could detect their lie in either the entire sample or an analysis on only those who passed the manipulation check. The finding that participants said they knew another person better if they were given information about them replicated in both the entire sample and the sample of those who passed the manipulation check, indicating that the manipulation did have some impact on participants. The replication of the mediation analysis is a more complicated question given that the main finding did not replicate. |
| Clarity: how unlikely is it that the study will be misinterpreted? | The explanation of this study in the paper is clear, and the statistics used for the main analysis are straightforward and easy to interpret. |
Detailed Transparency Ratings
| Overall Transparency Rating: | |
|---|---|
| 1. Methods Transparency: | The code used to program the study materials was provided on OSF. Authors were responsive to any remaining questions after reviewing the provided code. |
| 2. Analysis Transparency: | Analysis code was not available because the analysis was conducted using SPSS. Authors were responsive to questions. Analyses were described clearly, and the analyses used were not needlessly complex or esoteric. The results reported in the paper could be reproduced easily using the data provided online by the authors. |
| 3. Data availability: | Data were available on OSF. |
| 4. Pre-registration: | No pre-registration was submitted for Study 2A or the other 8 lab studies conducted between 2015-2021 in the paper. The field study was pre-registered. |
Summary of Study and Results
Study Summary
Our replication study (N = 475) examined whether people assigned a higher probability to the chance of another person detecting their lie if they were given information about that other person than if they were not. We found that the main result from the original study did not hold in our replication.
In the experiment, participants wrote 5 statements about themselves, 4 truths and 1 lie, and were told those statements would be shared with another person who would guess which one was the lie. Participants were either given 4 true statements about their ‘partner’ (information condition), or they were given no information about their ‘partner’ (no information condition). Participants were asked to assign a percentage chance to how likely their ‘partner’ would be to detect their lie after either being given this information or not. Note that participants in the study were not actually connected to another person, so for clarity we put the term ‘partner’ in single quotes in this report.
We collected data from 481 participants using the Positly platform. We excluded 4 participants who were missing demographic data. We also excluded 2 participants who submitted nonsensical single word answers to the four truths and a lie prompt. Participants could not proceed in the experiment if they left any of those statements blank, but there was no automated check on the content of what was submitted. The authors of the original study did not remove any subjects from their analysis, but they recommended that we do this quality check in our replication.
The data were analyzed primarily using two-tailed independent samples t-tests. The main analysis asked whether participants in the information condition assigned a different probability to the chance of their ‘partner’ detecting their lie than participants in the no information condition. We found that this main result did not replicate (Minfo = 33.19% (30.49–35.89%), n = 236 / Mno info = 33.00% (30.15–35.85%), n = 239; Welch’s t: t(472.00) = 0.095; p = 0.924; Effect size: d = 0.009).
Detailed Results
Primary Analyses
Table 1: Results – Entire Sample
| Hypothesis | Original Study Result | Our Replication Result | Result Replicated? |
|---|---|---|---|
| H1: Participants in the information condition will report a significantly higher percentage chance of lie detection by their ‘partner’ than participants in the no information condition.(entire sample) | Minfo = 41.06% (37.76–44.35%) n = 228; Mno info = 33.29% (30.34–36.24%) n = 234 Welch’s t: t(453.20) = 3.44 p <0.001 Effect size: d = 0.32 | Minfo = 33.19% (30.49–35.89%) n = 236 Mno info = 33.00% (30.15–35.85%) n = 239 Welch’s t: t(472.00) = 0.095 p = 0.924 Effect size: d = 0.009 | No |
| H2: Participants in the information condition will report significantly higher responses to how well they believe they know their ‘partner’. (entire sample) | Minfo = 3.04 95% CI = 2.83–3.25 n = 228; Mno info = 1.89 95% CI = 1.69–2.09 n = 234 Student’s t: t(460) = 7.73, p <0.001 Effect size: d = 0.72 | Minfo = 2.65 95% CI = 2.47–2.84, n = 236 Mno info = 1.61 95% CI = 1.45–1.77 n = 239 Student’s t: t( 473.00 ) = 8.387 Welch’s t: t(464.53) = 8.381 p < 0.001 for both Effect size: d = 0.770 (Student’s), d = 0.769 (Welch’s) | Yes |
| H3: Knowledge of the ‘partner’ mediates the relationship between the condition participants were assigned to and their assessment of the percentage chance that their ‘partner’ will detect their lie. (entire sample) | indirect effect = 3.83 bias-corrected 95% CI = 1.91–5.99 | indirect effect = 2.83 bias-corrected 95% CI = 1.24–4.89 | See Discussion |
Contingency Test
In the original study, the authors found that participants in the information condition were more likely to believe that they were connected to another person during the experiment than participants in the no information condition. Original study results: (58.3% (information condition) versus 40.6% (no information condition), χ2 = 14.53, p < 0.001, Cramer’s V = 0.18). Due to this issue, they ran their analyses again on only those participants who passed the manipulation check.
We performed the same contingency test as part of our replication study, and we did not have the same issue with our sample. Replication study results: (59.3% (information condition) versus 54.4% (no information condition), χ2 = 1.176, p = 0.278, Cramer’s V = 0.05). Despite not having this difference in our sample, we ran the same three tests on the subjects who passed the manipulation check (n = 270), as they did in the original study. These results are consistent with the results we obtained on our entire sample.
Secondary Analyses
Table 2: Results – Manipulation Check Passed Subsample
| Hypothesis | Original Study Result | Our Replication Result | Result Replicated? |
|---|---|---|---|
| H4: Participants in the information condition will report a significantly higher percentage chance of lie detection by their ‘partner’ than participants in the no information condition.(manipulation check passed only) | Minfo = 44.69% (40.29-49.09%), n = 133 Mno info = 35.60% (30.73-40.47%), n = 95 Student’s t: t(226) = 2.69 p =0.008 Effect size: d = 0.36 | Minfo = 33.91% (30.41–37.42%), n = 140 Mno info = 34.09% (30.11–38.05%), n = 130 Student’s t: t(268) = -0.64 Welch’s t: t(261.24) = -0.063 p = 0.95 for each test Effect size: d = -0.008 for both | No |
| H5: Participants in the information condition will report significantly higher responses to how well they believe they know their ‘partner’. (manipulation check passed only) | Minfo = 3.44, 95% CI = [3.15, 3.73] n = 133 Mno info = 2.53, 95% CI = [2.14, 2.92] n = 95 Welch’s t: t(185.48) = 3.67 p < 0.001 Effect size: d = 0.50 | Minfo = 2.93, 95% CI = [2.68, 3.18] n = 140 Mno info = 1.89, 95% CI = [1.62, 2.15] n = 130 Welch’s t: t(266.05) = 5.66 p < 0.001 Effect size: d = 0.689 | Yes |
| H6: Knowledge of the ‘partner’ mediates the relationship between the condition participants were assigned to and their assessment of the percentage chance that their ‘partner’ will detect their lie. (manipulation check passed only) | indirect effect = 4.18 bias-corrected 95% CI = [1.64, 7.35] | indirect effect = 3.25 bias-corrected 95% CI = [1.25, 5.8] | See Discussion |
Additional Analyses
We had a concern that participants who were not carefully reading the experimental materials may not have understood which information of theirs was being shared with their ‘partner’ in the study. To address that concern, we reminded participants that their ‘partner’ would not be told which of the 5 statements they shared was a lie. We also added a comprehension check question at the end of the experiment after all of the questions from the original experiment were asked. We found that 45 of 475 participants (9%) failed the comprehension check, which was a 4 option multiple choice question. Re-running the analyses excluding those who failed the comprehension check did not substantively change any of the results. (See Appendix for the specific language used in the reminder, and for the full table of these results.)
Interpreting the Results
Is Mediation Analysis appropriate without a significant total effect?
There is debate about whether it is appropriate to conduct a mediation analysis when there is no significant total effect. Early approaches to mediation analysis used a causal steps approach in which the first step was testing for the relationship between X and Y, and then testing for mediation if there is a significant X-Y relationship. In that approach a test for mediation is only done if a significant relationship exists for the total effects (Baron & Kenney, 1986). More recently, approaches to mediation analysis have been developed that do not rely on this approach, and the developers of more modern mediation analysis methods have argued that it can be appropriate to run a mediation analysis even when there is no significant X-Y relationship (Rucker et al, 2011; Hayes, 2013).
Some recent research attempts to outline the conditions under which it is appropriate to conduct a mediation analysis in the absence of a significant total effect (Agler & De Boeck, 2017; Loeys, Moerkerke & Vansteelandt, 2015). The conditions under which this is an appropriate step to take are when there is an a priori hypothesis that the mediated relationship is the important path to examine. That hypothesis could account for one of two situations in which an indirect effect might exist when there is no significant total effect:
- The direct effect and the indirect effect are hypothesized to have opposite signs. In this case, the total effect could be non-significant because the direct and the indirect effects cancel.
- There is hypothesized complete mediation (all of the effect in the total effects model is coming from the indirect rather than the direct path), and the statistical power of the total effects model is low. In this case the indirect effects model can offer more statistical power, which can lead to finding the indirect relationship that exists, despite the Type II error leading to incorrectly failing to reject the null-hypothesis in the total effects model.
Agler & De Boeck, 2017 and Loeys, Moerkerke & Vansteelandt, 2015 recommend against conducting a mediation analysis when there is no significant total effects model result unless there is a prior hypothesis that justifies that analysis. This is the case for the following reasons:
- Mediation analysis without a significant total effect greatly increases the chances for a Type I error on the indirect path, inflating the chances of finding a statistically significant indirect effect, when no real indirect effect exists.
- Mediation analysis can result in false positives on the indirect path that are caused by uncontrolled additional variables that influence both the mediator variable and the outcome variable. In a controlled experiment where the predictor variable is the randomized control, a total effects model of X → Y is not subject to the problem of uncontrolled additional variables, but once the mediator is introduced that problem re-emerges on the M → Y path.
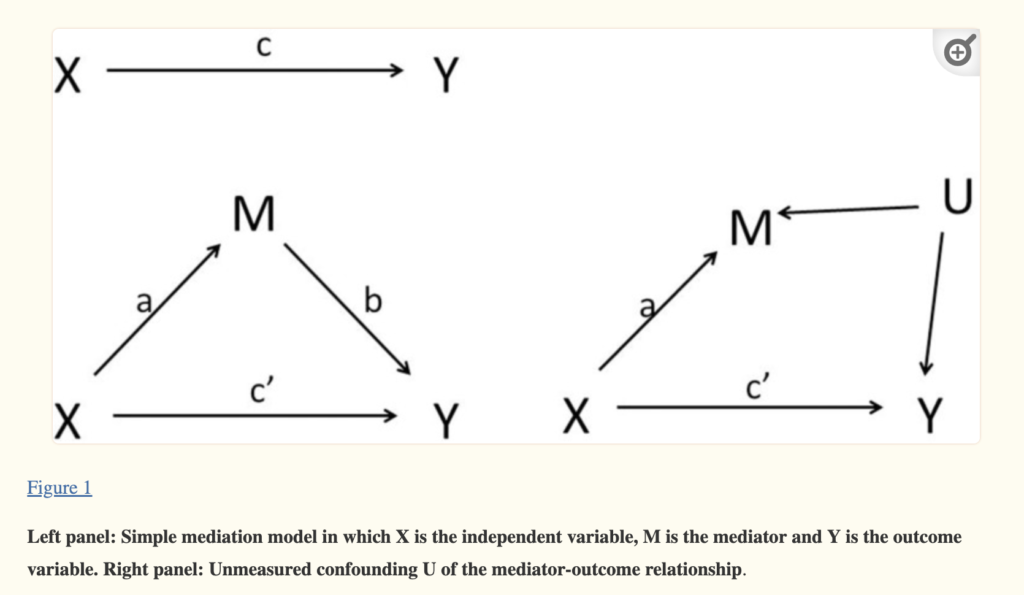
Figure 1 from Loeys, Moerkerke & Vansteelandt, 2015 illustrates this issue.
It is difficult to tell from the original study if the mediation analysis was hypothesized a priori because no pre-registration was filed for the study. The way the results are presented in the paper, the strongly significant relationship the authors find between the experimental condition and the main dependent variable, the prediction of lie detection, is given as the main finding (it is what is presented in the main table of results). The mediation analysis is described in the text as something done subsequently that supports the theorized mechanism connecting the experimental condition and the main dependent variable. There is no reason to expect from the paper that the authors believe that there would be a canceling effect between the direct and indirect effects, in fact that would be contrary to their hypothesized mechanism. And with 462 participants, their study doesn’t seem likely to be underpowered, although they did not conduct a power analysis in advance.
How should the Mediation Analysis results be understood?
We carried out the mediation analysis, despite the debate in the literature over its appropriateness in this circumstance, because we did not specify in the pre-registration that we would only conduct this analysis if the total effect was significant.
The mediation analysis (see tables 1 and 2 above) does show a significant result for the indirect path:
condition → knowThem → percentLieDetect
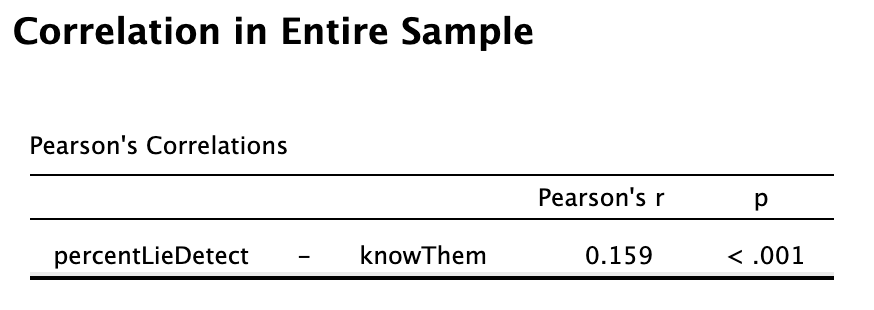
Digging into this result a bit more, we can identify a possible uncontrolled additional variable influencing both the mediator variable and the outcome variable that could account for the significant result on path b knowThem → percentLieDetect. First, here is the correlation between knowThem and percentLieDetect for the sample as a whole:
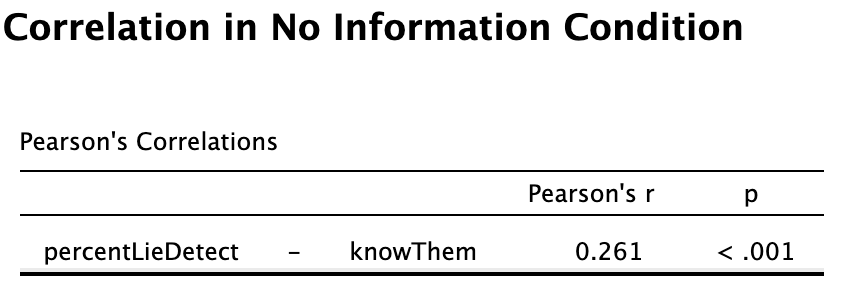
The troubling pattern we find is that random assignment to one condition or the other results in a distinct difference in whether participants’ responses to how well they know their ‘partner’ correlates with their assessment of how likely their ‘partner’ is to detect their lie. In the no information condition, there is a significant correlation between how well participants say they know their ‘partner’ and how high a percentage they assign to their ‘partner’ detecting their lie.
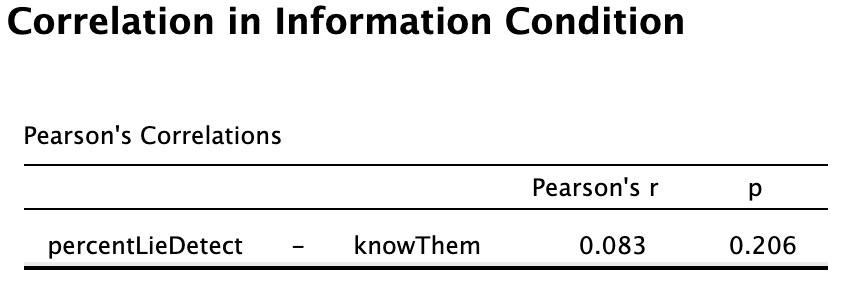
This relationship does not exist in the information condition. This means that, if a participant is given information about their ‘partner’, there is no relationship between how well they say they know their ‘partner’ and the percent chance they assign to their ‘partner’ detecting their lie.
Examining the scatter plot of the relationship between the two variables in the two conditions as well as the distribution of each variable in both conditions can help shed some light on why this might be.
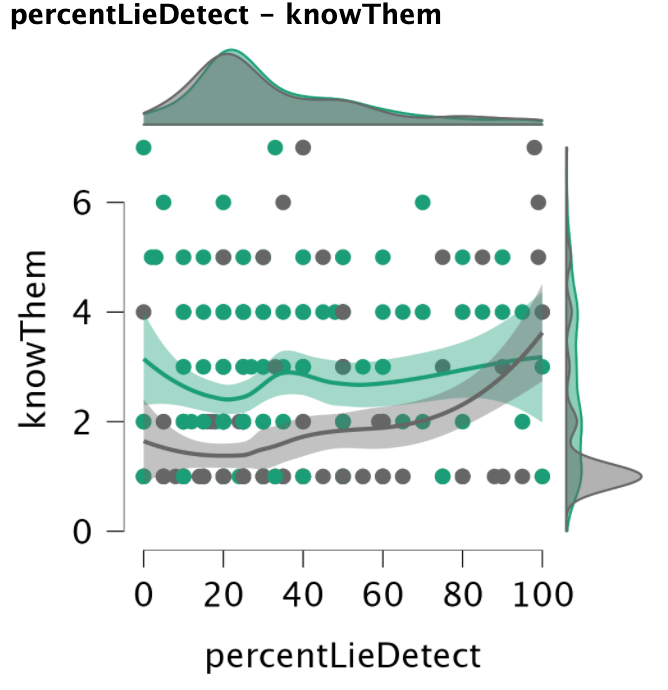
Why might this relationship exist in the no information condition, but not the information condition? One possible explanation is that the participants in the no information condition have a large cluster of responses at one point – an answer of ‘1’ on the knowThem question, and an answer of 20% on the percentLieDetect question. In our sample just over 25% of respondents in the no information condition gave this pair of responses. That response is the floor value on the knowThem question, and it’s at the low end on the percent question, where responses could range from 0-100.
It is not surprising that a large number of respondents in a condition where they have no information about their ‘partner’ would answer that they don’t know their partner at all, an answer of 1 on the 1-7 scale for the knowThem question. It is also understandable that a large portion of these respondents would also give an answer of 20% on the question of how likely they think their ‘partner’ would be to detect their lie, because that answer is the random chance that the one lie would be selected from five total statements. This pattern of responding suggests a group of participants in the no information condition who correctly understand that they don’t know anything about their ‘partner’ and their ‘partner’ doesn’t know anything about them.
Because the point that these 25% of respondents’ answers clustered at was near the floor on both variables, a statistically significant correlation is likely to occur even if the rest of the responses are random noise. We conducted a simulation which demonstrates this.
We constructed simulated data the size of the sample of our no information condition (N = 239). The simulated data contained a fraction of responses at 1 for knowThem and 20% for percentLieDetect (the signal fraction), and the remaining fraction was assigned randomly to values from 1-7 for knowThem and 0-100% for percentLieDetect (the noise fraction). We then looked at the correlation coefficient for the simulated data. We ran this simulation 10,000 times at each of 3 different noise fractions. The graph shows the probability density of a correlation coefficient being generated by the simulations.
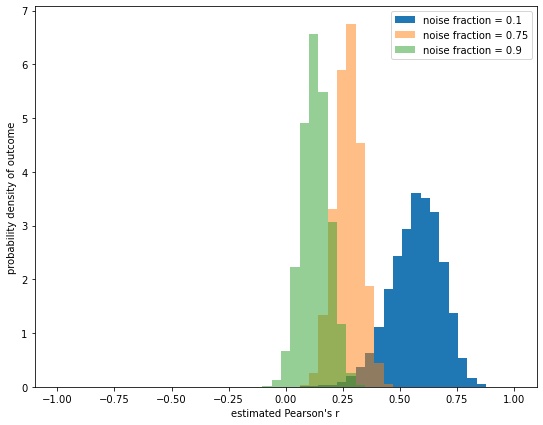
In yellow, there are 25% of respondents in the signal fraction at 1 and 20%, and 75% noise. That is similar to the percent of respondents who answered 1 and 20% in the no information group in the replication. When the pattern of 75% noise responses and 25% at 1 and 20% responses is simulated 10,000 times, typically it results in a correlation between 0.25 and 0.3. The correlation in our actual data is 0.26.
Note that as the percentage of respondents anchored at the one point increases, from 10% in the green to 25% in the yellow to 90% in the blue, the strength of the correlation increases, as long as there are at least some random noise responses to create other points for the correlation line to be drawn through.
The python code used to run this simulation and generate this graph is available in the appendix.
This result suggests that the significant result in the indirect path of the mediation analysis in our replication could be the result of a statistical artifact in the no information condition in the relationship between the mediator variable knowThem and the dependent variable percentLieDetect. In the absence of a significant total effects relationship between the experimental condition and the main dependent variable, and given this potential cause of the knowThem→percentLieDetect relationship on the indirect path, the significant effect in the indirect path in the mediation analysis cannot be considered strong evidence.
Conclusion
The big question that this pattern of results drives us to ask is ‘Why did the authors get such a strongly significant result in their sample, if there is really no relationship between the experimental condition and their main DV?’ Since we were surprised to go from a result in the initial paper with significance of p < 0.001 to a significance level of p > 0.90 in the replication we did several checks to help make sure that there were no coding errors in our data or other explanations for our results.
One possible explanation for the large difference between the replication results and the results in the initial study could be the confounding of the success of the manipulation check with the experimental condition reported in the original study. In the original study data fewer people in the no information condition (only 40%) believed that they had been connected to another person in the study, while 58% of the participants in the information condition believed that they were connected to another participant in the study. The authors reported finding this in their contingency test. The attempt that the authors made to resolve this problem by running their analyses again on only those who passed the manipulation check may have created a selection bias since the people who passed the manipulation check and the people who failed it were not necessarily random. It is also possible that other sample differences could account for this difference in results.
A potential lesson from the failure of this study to replicate is that sample oddities, like the confounding between the success of the manipulation and the experimental condition in this paper, may have deeper implications for the results than are easily recognized. In this case, much to the authors’ credit, the authors did the contingency test that revealed this oddity in their sample data, they reported the potential issue posed by this result, and they conducted a subsequent analysis to attempt to address this issue. What they did seemed like a very reasonable solution to the oddity in their sample, but upon replication we learned that it may not be an adequate solution.
Author Acknowledgement
We are grateful to Dr. Anuj K. Shah and Dr. Michael LaForest for the feedback provided on the design and execution of this replication. Any errors or issues that may remain in this replication effort are the responsibility of the Transparent Replications by Clearer Thinking team.
We provided a draft copy of this report to the authors for review on October 17, 2022.
We appreciate Dr. Shah and Dr. LaForest for their commitment to replicability in science, and for their transparency about their methods that made this replication effort possible.
Thank you to Spencer Greenberg and Clare Harris at Transparent Replications who provided valuable feedback on this replication and report throughout the process. Thank you also to Eric Huff for assistance with the simulation, and Greg Lopez for reviewing the report and analyses. Finally, thanks to the Ethics Evaluator for their review, and to the participants for their time and attention.
Purpose of Transparent Replications by Clearer Thinking
Transparent Replications conducts replications and evaluates the transparency of randomly-selected, recently-published psychology papers in prestigious journals, with the overall aim of rewarding best practices and shifting incentives in social science toward more replicable research.
We welcome reader feedback on this report, and input on this project overall.
Appendices
Additional Information about the Study
The wording in our replication study was the same as that of the original study, with the exception that we added a clarifying reminder to participants that their ‘partner’ would not be told which of their 5 statements was a lie. In the course of suggesting revisions to our replication study materials, the original author team reviewed the reminder language and did not express any concerns about it.
In the information condition, the original study wording was, “We have connected you to another person on the server and showed them your five statements.” Our wording in the information condition was, “We have connected you to another person on the server. We showed them all five of your statements and we did NOT tell them which ones were true.” For both the original study and our study, participants in the information condition then saw four true statements about their ‘partner.’ The statements used were the same in the original study and our replication.
In the no information condition, the original study wording was, “We have connected you to another person on the server and showed them your five statements.” Our wording in the no information condition was, “We have connected you to another person on the server. While we didn’t show you any information about the other person, we showed them all five of your statements and we did NOT tell them which ones were true.”
Additional Analyses
Detailed Results excluding participants who failed a comprehension check
Table 3: Results – Replication Sample with Exclusions
| Hypothesis | Entire Replication Sample Excluding Failed Comprehension Check | Manipulation Check Passed Replication Subsample Excluding Failed Comprehension Check | Result Replicated? |
|---|---|---|---|
| Participants in the information condition will report a significantly higher percentage chance of lie detection by their ‘partner’ than participants in the no information condition. | Minfo = 32.81% (30.03–35.58%), n = 211; Mno info = 32.44% (29.46–35.42%), n = 219 Welch’s t: t(426.80) = 0.175 p = 0.861 Effect size: d = 0.017 | Minfo = 33.58% (29.98–37.17%), n = 125 Mno info = 33.73% (29.60–37.86), n = 119 Welch’s t: t(235.78) = -0.056 p = 0.956 Effect size: d = -0.007 | No |
| Participants in the information condition will report significantly higher responses to how well they believe they know their ‘partner’. | Minfo = 2.60, 95% CI = [2.41, 2.79] n = 211; Mno info = 1.54, 95% CI = [1.39, 1.70] n = 219 Student’s t: t(428) = 8.54 Welch’s t: t(406.93) = 8.51 p < 0.001 for both Effect size: d = 0.824 (Student’s) 0.822 (Welch’s) | Minfo = 2.81, 95% CI = [2.54, 3.07] n = 125 Mno info = 1.77, 95% CI = [1.52, 2.02] n = 119 Student’s t: t(242) = 5.55 Welch’s t: t(241.85) = 5.56 p < 0.001 for both Effect size: d = 0.711 (Student’s), d = 0.712 (Welch’s) | Yes |
| Knowledge of the ‘partner’ mediates the relationship between the condition participants were assigned to and their assessment of the percentage chance that their ‘partner’ will detect their lie. | indirect effect = 2.39 bias-corrected 95% CI = 0.50–4.66 | indirect effect = 2.92 bias-corrected 95% CI = 0.84–6.00 | See Discussion |
Analysis Code
Python Code for Simulation
References
Agler, R. and De Boeck, P. (2017). On the Interpretation and Use of Mediation: Multiple Perspectives on Mediation Analysis. Frontiers in Psychology 8: 1984. https://doi.org/10.3389/fpsyg.2017.01984
Baron, R. M., & Kenny, D. A. (1986). The moderator–mediator variable distinction in social psychological research: Conceptual, strategic, and statistical considerations. Journal of Personality and Social Psychology, 51(6), 1173–1182. https://doi.org/10.1037/0022-3514.51.6.1173
Hayes, A. F. (2013). Introduction to mediation, moderation, and conditional process analysis: A regression-based approach. Guilford Press.
Loeys, T., Moerkerke, B. and Vansteelandt, S. (2015). A cautionary note on the power of the test for the indirect effect in mediation analysis. Frontiers in Psychology 5: 1549. https://doi.org/10.3389/fpsyg.2014.01549
Rucker, D.D., Preacher, K.J., Tormala, Z.L. and Petty, R.E. (2011). Mediation Analysis in Social Psychology: Current Practices and New Recommendations. Social and Personality Psychology Compass, 5: 359-371. https://doi.org/10.1111/j.1751-9004.2011.00355.x
Shah, A.K., & LaForest, M. (2022). Knowledge about others reduces one’s own sense of anonymity. Nature, 603, 297–301. https://doi.org/10.1038/s41586-022-04452-3
