Executive Summary
| Transparency | Replicability | Clarity |
|---|---|---|
The main finding was not replicated, but there was a trend toward significance and the effect was in the same direction in our replication dataset as in the original study. |
We replicated an experiment from this PNAS paper. Adults participated in a computerized (simulated) apple-picking (foraging) task and completed an adverse childhood experiences (ACEs) questionnaire. The original study found those with high levels of adverse childhood experiences (ACEs) tended to spend longer picking apples before moving to a new tree in the simulated foraging task compared to adults with fewer ACEs. From this, it was inferred that people with high ACEs tend to explore less than those with low ACEs. The main finding didn’t replicate in our study, although there was a trend in the same direction as the original experiment.
The paper received a moderate transparency rating. Experimental materials and scripts were shared transparently, although the public materials were missing important data cleaning steps, and the experiment and analysis scripts required substantial editing in order to run properly. The primary weakness in transparency was that the paper described the study as pre-registered, but there were major deviations from the pre-registration which were not acknowledged in the paper or supplementary materials.
Several factors limited the paper’s clarity. Firstly, we think the findings have more limited generalizability than the paper suggested. The paper could also have discussed several alternative explanations for the findings. Finally, certain terms were used in ways that were counterintuitive and also inconsistent with the paper from which the terms were derived.
Full Report
Study Diagram
Replication Conducted
We ran a replication of the main study from:
Lloyd, A., McKay, R. T., & Furl, N. (2022). Individuals with adverse childhood experiences explore less and underweight reward feedback. Proceedings of the National Academy of Sciences, 119(4), e2109373119.
How to cite this replication report: Transparent Replications by Clearer Thinking. (2025). Report #13: Replication of “Individuals with adverse childhood experiences explore less and underweight reward feedback” (PNAS | Lloyd, McKay & Furl, 2022) https://replications.clearerthinking.org/replication-2022pnas119-4
Key Links
- Our Research Box for this replication report includes the pre-registration, de-identified data, and analysis files.
Overall Ratings
To what degree was the original study transparent, replicable, and clear?
| Transparency: how transparent was the original study? | The data, code, and materials were publicly shared; however, the shared materials were missing important data cleaning steps, and the analysis scripts required substantial editing in order to reproduce the original results. The experiment also had a bug which we fixed. The primary weakness in transparency was that the study was described as pre-registered, but there were major deviations from the pre-registration, and these were not acknowledged in the paper or supplementary materials. We outline the discrepancies in a table. |
| Replicability: to what extent were we able to replicate the findings of the original study? | The main finding did not replicate, but there was a trend toward significance and the effect was in the same direction in our replication dataset as in the original study. |
| Clarity: how unlikely is it that the study will be misinterpreted? | We think the findings have more limited generalizability than the paper suggested, and several alternative explanations for the findings could have been discussed. Finally, certain terms were used in ways that were counterintuitive and also inconsistent with the paper from which the terms were derived. |
Detailed Transparency Ratings
| Overall Transparency Rating: | |
| 1. Methods Transparency: | There were some missing elements, but we were provided with further materials on request, and the missing information did not prevent us from replicating the study. The authors hadn’t provided the original Gorilla code on their online repository, or the specific wording of the ACE questionnaire, but they provided these promptly following specific requests. The Gorilla code still required several changes before it was able to function as expected. The authors also hadn’t included their participant-facing description of the study (including how the bonus system was described to participants), but they provided details about how they told participants about the bonus on request. |
| 2. Analysis Transparency: | We outline ways in which analysis transparency could have been improved in a table in the appendix. |
| 3. Data availability: | A cleaned version of the dataset was publicly available and we were able to reproduce the original results using it.A de-identified version of the raw dataset, however, was not publicly available, so we confirmed that the data cleaning steps worked by doing them on freshly generated data. |
| 4. Preregistration: | The original paper stated that the study was pre-registered, but there were major deviations from the pre-registration, none of which were acknowledged in the paper or supplementary materials. We outline the discrepancies in a table in the appendices of this report. |
Summary of Study and Results
The study we replicated sought to investigate how decision-making in adults is impacted by childhood experiences of adversity. The scientific aim of the original paper was to “inform our understanding of the computational mechanisms underlying different decision-making strategies associated with early adversity and their relationship with risk-taking behaviors.” The authors also recognized the ethical implications of this research, highlighting “the need for children to be protected from these experiences.”
The titular result of the original paper (which we refer to hereafter as the “headline result” or “main result”) was that adults “with adverse childhood experiences explore less and underweight reward feedback.” In their concluding paragraph, the authors summarize their study as having “demonstrated that ACEs are associated with reduced exploration and with underweighting positive-reward feedback in a patch-foraging paradigm.”
The authors reached this conclusion by recruiting people from both trauma support groups and the general population, then administering a widely-used computerized apple-picking task intended to track differences in individuals’ tendencies to explore (versus exploit) environments with different distributions of rewards (different distributions of apples per “harvest”). They also administered an ACEs questionnaire to all participants.
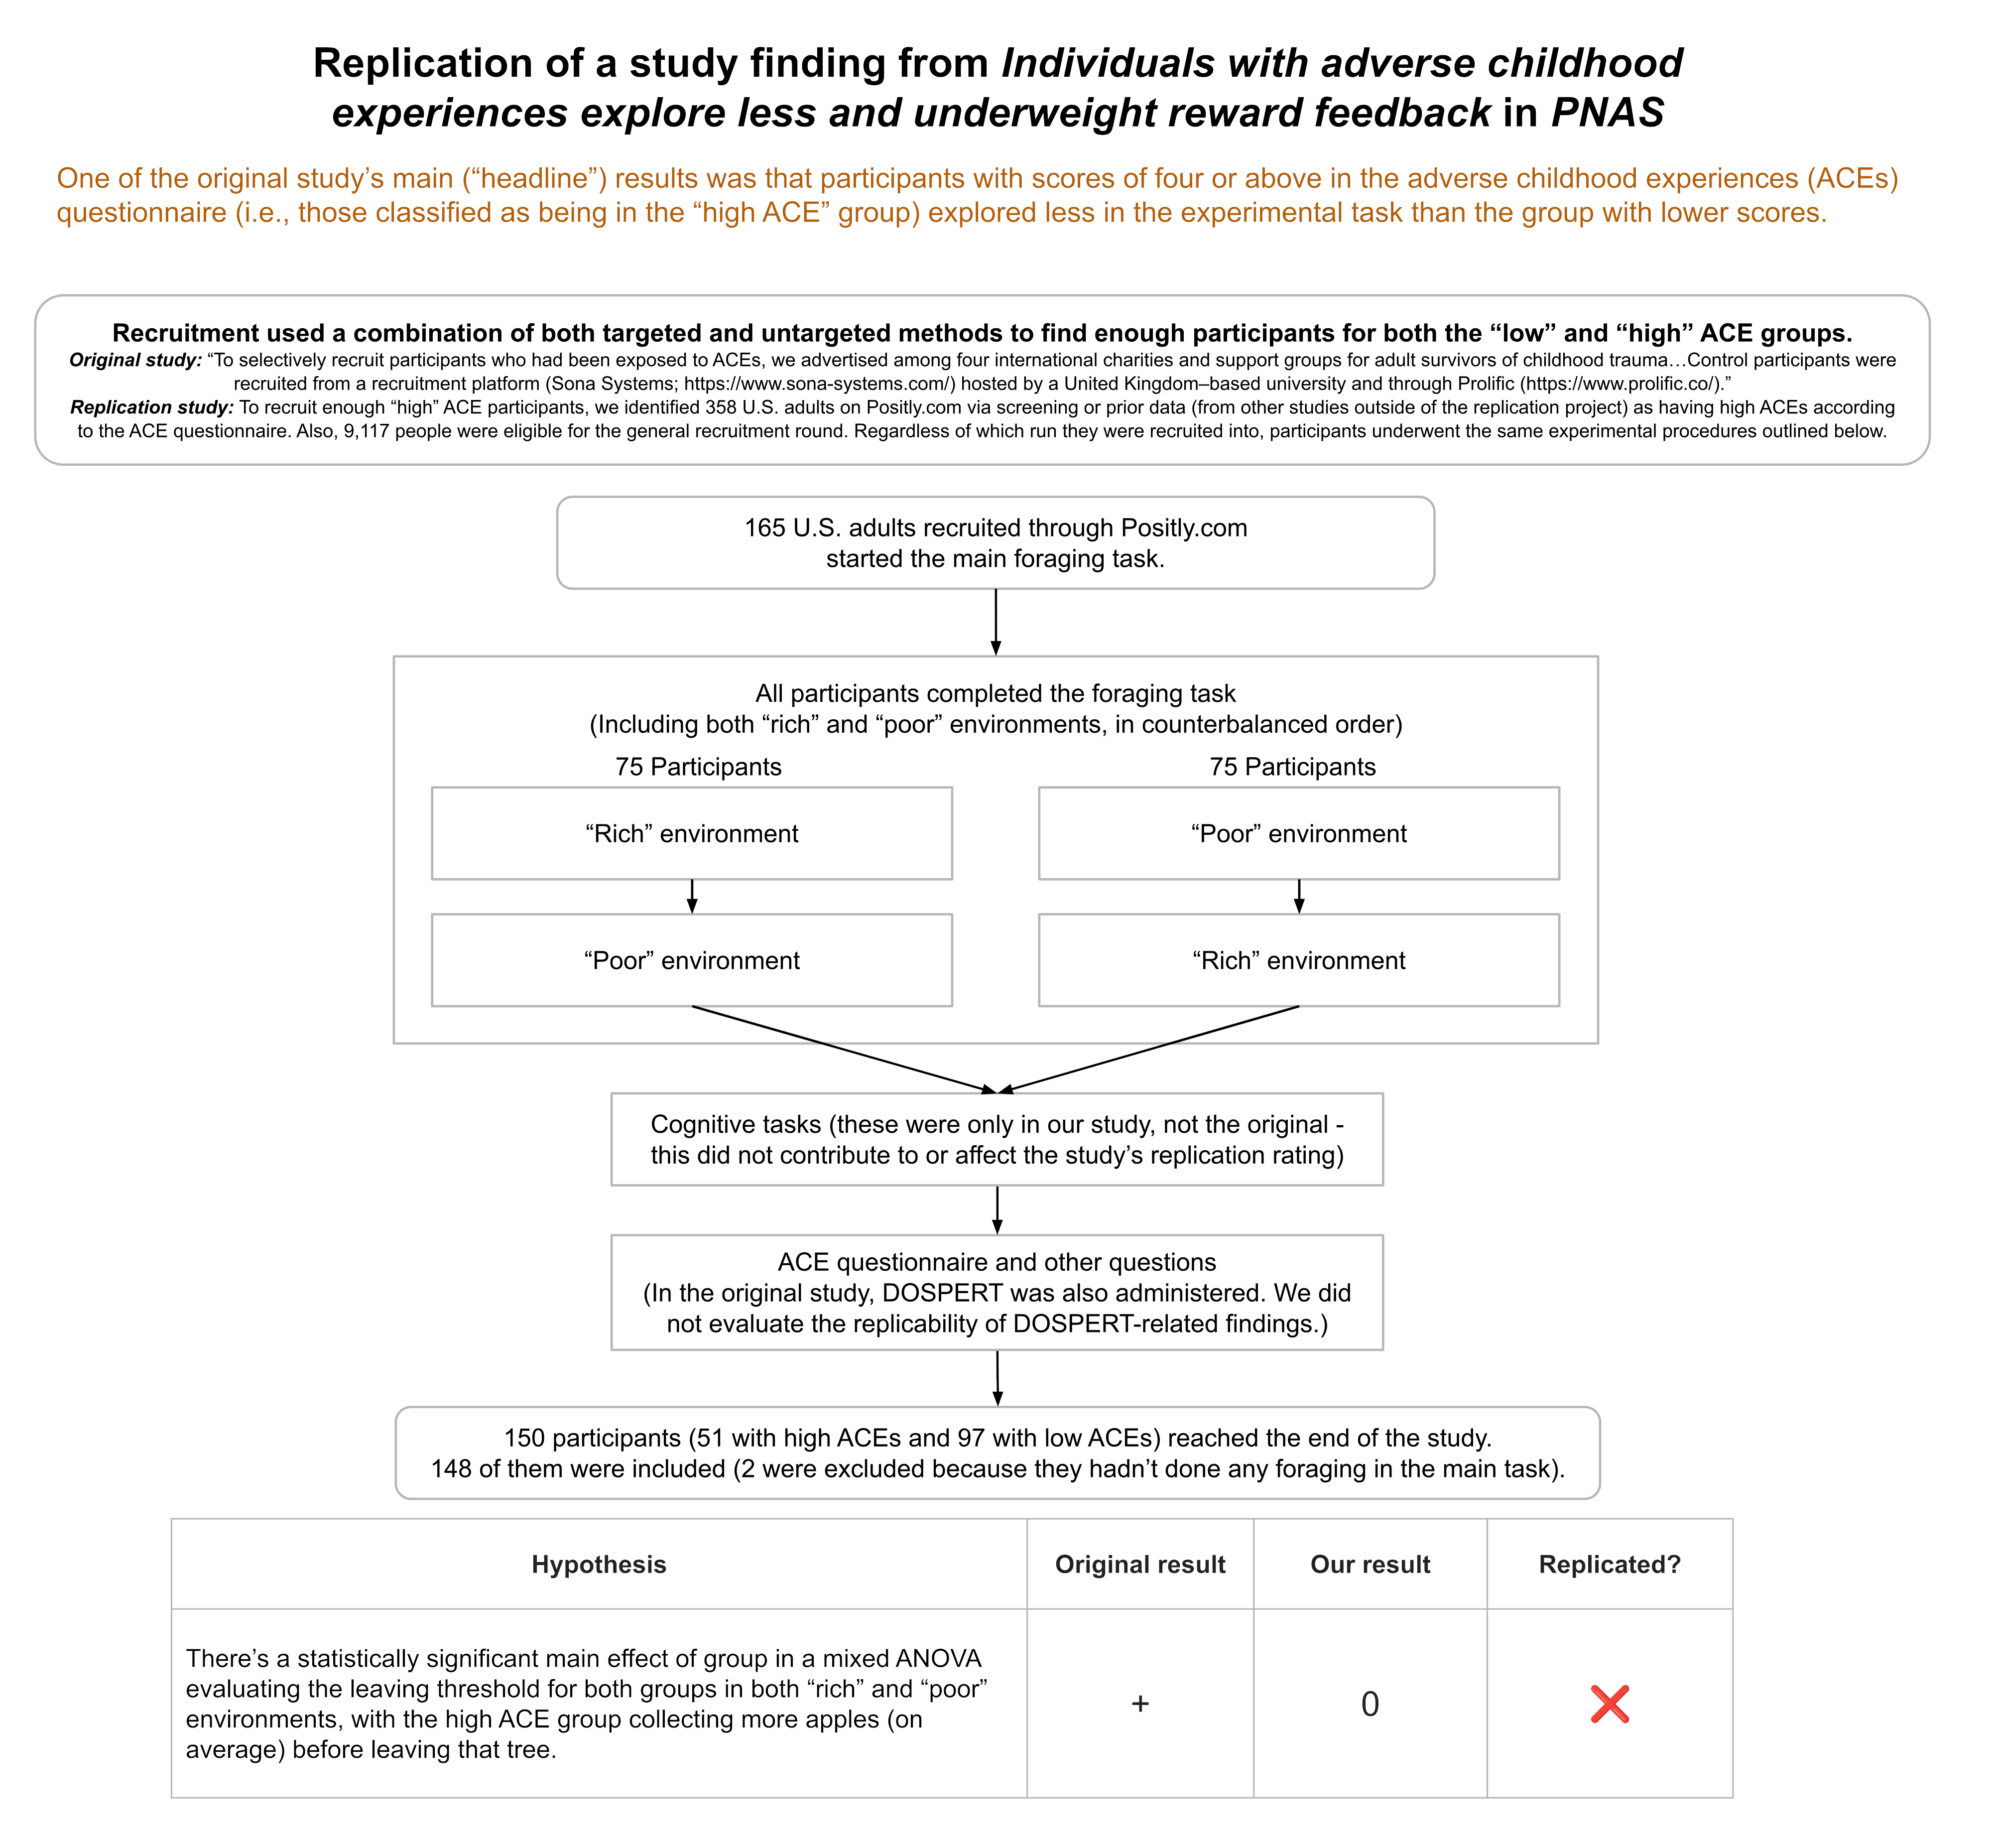
To put the original paper’s main result more precisely: participants with scores of four or above in the study’s ACEs questionnaire (i.e., those classified as being in the “high ACE” group) explored less in the experimental task than individuals in the “low ACE” group. The authors made that claim based on a mixed analysis of variance (ANOVA), with the richness of the digital foraging environment as the factor that varied within all participants (i.e., the within-subjects factor) and ACE group as the factor that distinguished one group from another (i.e., the between-subjects factor).
The analysis evaluated the average number of apples left at the time a participant switched from one tree to the next, for the last two trees of that environment; the authors refer to this as the “leaving threshold”. In the original dataset, there was a statistically significant main effect of group (having high vs. low ACEs): the high ACE group had fewer apples left in each tree on average (i.e., staying longer) before they switched to new trees (i.e., they tended to “exploit” for longer and didn’t tend to “explore” the next tree until later).
We did the same analysis in our replication dataset. In our replication, the main effect of group was not significant, although our dataset did show a trend toward significance [F(1,144) = 2.975, p = 0.087, η² = 0.019], with effects in the same direction as in the original study.
| ANOVA results | Original study | Replication |
|---|---|---|
| Result: Main effect of group (high vs. low ACE groups’ leaving thresholds) | F(1,137) = 4.460, η² = 0.027 | F(1,144) = 2.975, η² = 0.019 |
| p value | 0.037 * | 0.087 |
The original pre-registration did not include a plan to run an ANOVA but instead had said that t-tests would be the analyses of interest. So, although t-tests were not reported in the original paper or supplementary materials, we did run t-tests on both datasets, comparing leaving thresholds between ACE groups (within both environments separately and also on average overall). The tables below show the results.
| T-test results – poor environments | Original study | Replication |
|---|---|---|
| Result: Difference in average leaving thresholds between independent groups (high vs. low ACE groups’ leaving thresholds) within the poor environments | t(143) = 2.067 | t(144) = 1.602 |
| p value | 0.041 * | 0.111 |
| T-test results – rich environments | Original study | Replication |
|---|---|---|
| Result: Difference in average leaving thresholds between independent groups (high vs. low ACE groups’ leaving thresholds) within rich environments | t(137) = 1.577 | t(144) = 1.750 |
| p value | 0.117 | 0.082 |
As seen in the tables above, the original study had different degrees of freedom for the t-test comparison within the rich environment compared to the poor environment. That was because there were six participants who had missing leaving thresholds in the rich environment.1
| T-test results – average leave thresholds across both environments | Original study – excluding participants with missing rich environment data2 | Replication |
|---|---|---|
| Result: Difference in average leaving thresholds between independent groups (high vs. low ACE groups’ leaving thresholds) overall | t(137) = 2.11 | t(144) = 1.725 |
| p value | 0.037 * | 0.087 |
In the original study, participants also completed an additional questionnaire after the experimental task, but as described in the next section, that questionnaire wasn’t administered in the replication study, since the analyses involving that questionnaire produced null results in the original study.
In the in-depth sections that follow, we explain aspects of the original study design that meant that some alternative explanations for the headline results couldn’t be tested until we amended certain aspects of the study design. We also discuss the t-test results in more depth and suggest reasons that the generalizability of the original study findings may be limited.
Study and Results in Detail
This section explains the recruitment procedures, study tasks, exclusion criteria, data cleaning, and data analysis steps, as well as going into more detail about the results presented above.
Recruitment methods
The original study used two complementary recruitment methods:
“To selectively recruit participants who had been exposed to ACEs, we advertised among four international charities and support groups for adult survivors of childhood trauma. These were the following: Survivors South West Yorkshire, the National Association for People Abused in Childhood (NAPAC), The Survivor’s Trust, and one anonymous support group. Control participants were recruited from a recruitment platform (Sona Systems; https://www.sona-systems.com/) hosted by a United Kingdom–based university and through Prolific (https://www.prolific.co/). The Prolific sample was recruited from the same regions that the charities were based in the United Kingdom and Europe”
We clarified this with the authorship team, and they informed us that most participants in the high ACE group were recruited from the charities/support groups, while a small proportion of them were recruited through Sona/Prolific.
In our study, all participants were recruited via Positly. We also used complementary recruitment strategies, including some specifically targeting those who’d be expected to have higher ACE scores. More specifically:
- For some of our experiment “runs” on Positly, the only participants who were shown the study or able to participate were those who had previously completed an ACE questionnaire in a past study on the same platform and who had a score of at least 4 recorded on our system from that past study.
- The other “runs” on Positly allowed any participants to participate.
- All participants were recruited via Positly, and at the end of our study, all participants still completed the same ACE questionnaire version as the one in the original study.
Consent and study description
In both the original study and our replication, participants were told (as part of the consent form) that they would complete some computerized tasks and that they would answer questions about their childhood, which might be stressful. The original authors rightly highlighted the importance of considering the ethical implications of a study like this. As part of the consent form, participants were informed that they could withdraw from the study at any time without penalty. A copy of the consent form is in the appendices.
Those who consented were then given instructions on the simulated apple foraging task. They completed a practice run followed by the actual task. At the completion of the task, participants were directed to questionnaires. (The differences between their questionnaires and ours, which did not affect the replicability rating, are explained in a later section.)
Overview of the task
The task was administered in GorillaTM Experiment Builder. We requested and obtained the original code from the original authors. Screenshots of the experiment are included below as well as in the original paper.
The foraging task instructed participants that they would be presented with a “tree” of “apples” and that they’d have to choose whether to “stay” at the tree (by pressing “S”) to collect apples or to “leave” the tree (by pressing “L”) to move to another tree.
If a participant chose to “stay” at a given decision point, they were next presented with a picture of a set of apples (representing the number that they had “picked” due to having selected to “stay”) and were simultaneously shown a number on the screen (representing an overall cumulative score so far).
If they chose to “leave,” participants were presented with a stationary cartoon of a person walking before being presented with the next tree and the next decision point (to stay or leave). If they didn’t make a decision within 3 seconds, this was treated as a timeout, and they were presented with the still image of the walking person to symbolize moving to the next tree.
Each tree had progressively fewer apples to “pick” each time the participant “stayed” at a given tree, and the rate at which apples were depleting depended on which “environment” the participant was in for that part of the experiment (explained below).
The number of apples left at the point where a participant moved to the next tree was called the “leaving threshold.” The “average” leaving threshold for a given environment was the average number of apples “from the last two harvests,” which is also what Constantino & Daw (2015) did in their stochastic depletion experiments.
 |
| S keypress (“stay” decision) |
 |
|
| S keypress (“stay” decision) |
 |
|
| L keypress (“leave” decision) |
 |
Instructions given to participants
After consenting, participants were presented with the following instructions:
“Your aim is to collect as many apples as possible within the time limit. The more apples you collect, the larger your score at the end of this experiment and the bigger your prize will be.
- You can either stay to continue picking apples from the current tree or leave and find a new tree. If you leave and travel to a new tree, you have to wait a fixed amount of time. This time is fixed and has nothing to do with your internet connection or page loading.
- You will only need your keyboard for this task. You can either press ‘S’ to stay with the tree or ‘L’ to leave the tree and find a new one.
- You will not know how many apples are on a new tree until you stay and pick them, so it is a good idea to stay with each tree at least once before moving on.
- The number of apples left on a tree will decrease with time, meaning there will be fewer apples left on the tree to collect the longer you stay there. Apples do not grow back on each tree, so your job is to decide how long you want to spend at each tree.
After seven minutes you will move into a completely new environment (think of it as a new orchard). This environment may be richer or poorer than the others. In some environments it may be better to stay with a tree for longer and in others it may be better to stay with a tree for less time.
After completing the study, you will earn an additional bonus payment of up to $3, based on your score!
You will now begin a quick practice run of the study. Your practice score will not count towards your score in the main task. The task should take 16 minutes altogether (including the practice).”
“Rich” and “Poor” Environments
In both the original study and our replication, each participant was exposed to two different environments. In both the original and in our replication, the order of the two environments was counterbalanced across participants.
In the original study, the environments were distinguished by the following features:
- Rich environment: apples reduced more gradually; travel time between trees was 6 seconds
- Poor environment: apples reduced more rapidly; travel time between trees was 12 seconds
In our replication, the environments had the following characteristics:
- Rich environment: apples reduced more gradually (consistent with original study); travel time between trees was 6 seconds (consistent with original study)
- Poor environment: apples reduced more rapidly (consistent with original study); travel time between trees was 6 seconds (shorter than original study to maintain consistency in travel time between environments)
The reason we kept travel time the same between the environments (6 seconds between trees for both environments) was so that the only characteristic that differed between the environments was the rewardingness of the trees, not the costs of switching trees. We thought it was important, like the original paper mentioned in its introduction, to just vary one of those things at a time.3
This point seems especially important given that the original study demonstrated that people in the high ACE group tended to stay longer (compared to those in the low ACE group) when harvesting from trees in the poor environment, but the same did not apply in the rich environment. That finding could have been consistent with either those with high ACEs having higher sensitivity to costs, or reduced reward sensitivity, or a combination of both, but because both costs and rewards were being varied concurrently, we can’t disentangle the effects based on the original study. The replication study only varied rewards between environments, to simplify the interpretation of results.4
Questions after the experimental task
Following the task, participants in the original experiment did both an ACE questionnaire and the Domain-Specific Risk-Taking scale (DOSPERT) survey (Blais & Weber, 2006). We did not administer the DOSPERT survey because the analyses of data from that survey yielded null results in the original study. As we discuss in the Clarity section, instead of the hypothesis that involved the DOSPERT-related analyses, we are instead only focusing on the headline result from Hypothesis 1a for the replicability rating of this study.
Instead of the DOSPERT, we administered a cognitive task. We administered the cognitive task prior to the ACE questionnaire to avoid potentially negatively impacting participants’ performance by reminding them of adverse childhood experiences (where applicable).5
Cognitive Task
The original study collected information pertaining to educational attainment among the participants but did not investigate the possibility that cognitive abilities differed between the two groups. Since we hypothesized that this could have been one of the potential explanations behind their findings, we included a three-minute-long cognitive task based on a study of over 3,000 people by Clearer Thinking. An intelligence quotient (IQ) was predicted for each participant based on their performance in those tasks.
Data exclusion criteria
For our main analysis, we used the same rules for excluding observations as the original study. We note that the original study’s pre-registration ( https://osf.io/8znyx/registrations ) stated that “During the task, trials where participants timeout (i.e. do not provide a response in the allocated time) will be excluded, as this does not provide information about participants’ leaving values and is therefore uninformative in the analysis.” However, following further correspondence with the original authors, it became clear that their final exclusion criteria for timeouts differed from their pre-registration. Timeouts in the original study resulted in the exclusion of both the individual timed out trial and all preceding trials for that particular foraging patch (i.e., a given apple tree). In their words:
“It is important that patches where participants timed out are not included in the leaving threshold analysis, as they do not tell us anything about when participants chose to leave their current patch and explore a new one. Therefore, it is important to exclude data from patches (not just trials) where participants timed out. This process can be quite laborious. However, it is a necessary step.”
In accordance with what the original study did and the authors’ recommendations, our replication excluded all trials from any foraging patch (tree) where a participant timed out.
After a set number of forages on a given tree (33 in the poor environment and 60 in the rich environment), participants were forced to advance. These thresholds represent the number of forages required to receive zero apples for more than one screen for any possible tree for that environment. These were treated as timeouts in our analysis. For our main analysis, even if a participant stayed in one or more of their runs until there were zero apples left, we still included their other data from other runs. For our supplementary analysis, we excluded participants if they attempted to continue to select “stay” after zero apples had already displayed for more than one trial, since that suggested they were not being adequately attentive.
Lastly, anyone who didn’t complete the whole study was excluded. As a result of the exclusion criteria above, two people were excluded from the dataset. These two participants never chose to pick apples and always timed out.
Data cleaning and analysis
The data cleaning steps were not shared on the original OSF site with the study materials. Fortunately, the original authorship team readily shared them with us upon request. Data cleaning instructions were shared as a word document with written instructions for spreadsheet manipulation to prepare data for analysis. The manual and non-standard data cleaning materials introduced unnecessary labor and opportunities for human error, reducing the original study’s transparency rating. The rating could have been improved by sharing a more standardized, accessible version of data cleaning materials, such as an R script.
The analysis code was provided on the OSF site with study materials, but was not sufficient on its own to reproduce their results – significant additional editing was required to be able to reproduce their results.
The study was pre-registered, and that fact was mentioned in the paper. However, the specific statistical tests reported in the paper had no overlap with the tests listed in pre-registration; this change in analysis methods was not acknowledged in the paper or supplementary materials.
Results in detail
The main finding did not replicate in our dataset, although there was a trend in the same direction as the original results.
The mixed ANOVA described earlier was run on our replication dataset (once again comparing the average number of apples left before a participant switched to another tree, with foraging environment as the within-subjects factor and ACE group as the between-subjects factor). Consistent with the original study, we did find a significant main effect of environment [F(1,144) = 28.576, p < .001, η² = 0.011]; participants switched to the next tree when there were more apples left (on average) in the rich environment compared to the poor environment. The headline result, though – the main effect of group – was not significant in our replication, although our dataset did show a trend toward significance [F(1,144) = 2.975, p = 0.087, η² = 0.019], with effects in the same direction – i.e., participants classified into the high-ACE group had a trend towards leaving when there were fewer apples left (i.e., they took longer to switch trees – they “explored” less) than those in the low-ACE group. As in the original study, there was again no significant interaction between environment type and ACE exposure [F(1,144) = 0.071, p = 0.791, η² < 0.001].
Here is another copy of the results table from the summary section (included again here to spare our readers from scrolling).
| ANOVA results | Original study | Replication |
|---|---|---|
| Result: Main effect of group (high vs. low ACE groups’ leaving thresholds) | F(1,137) = 4.460, η² = 0.027 | F(1,144) = 2.975, η² = 0.019 |
| p value (* means p < 0.05) | 0.037 * | 0.087 |
Simplest Valid Analysis: t-test results
We also ran t-tests on both the original and replication datasets, comparing leaving thresholds between ACE groups (within both environments separately and also on average overall). The tables below show the results (shown here again for convenience).
| T-test results – poor environments | Original study | Replication |
|---|---|---|
| Result: Difference in average leaving thresholds between independent groups (high vs. low ACE groups’ leaving thresholds) within the poor environments | t(143) = 2.067 | t(144) = 1.602 |
| p value (* means p < 0.05) | 0.041 * | 0.111 |
| T-test results – rich environments | Original study | Replication |
|---|---|---|
| Result: Difference in average leaving thresholds between independent groups (high vs. low ACE groups’ leaving thresholds) within rich environments | t(137) = 1.577 | t(144) = 1.750 |
| p value (* means p < 0.05) | 0.117 | 0.082 |
As mentioned, the original study had different degrees of freedom for the t-test comparison within the rich environment compared to the poor environment because there were six participants who had missing leaving thresholds in the rich environment.
| T-test results – average leave thresholds across both environments | Original study – excluding participants with missing rich environment data6 | Replication |
|---|---|---|
| Result: Difference in average leaving thresholds between independent groups (high vs. low ACE groups’ leaving thresholds) overall | t(137) = 2.11 | t(144) = 1.725 |
| p value (* means p < 0.05) | 0.037 * | 0.087 |
Interpretation of the results
The original paper made it very clear in their abstract and in the body of the paper that some of their hypotheses had not been supported by their experimental findings. They also clearly communicated what the experiment involved and what the effect sizes were; the graphs were particularly clear in that they displayed key variables using violin plots and included outliers (instead of displaying box plots alone, for example).
However, the paper’s clarity suffered with respect to its discussion of the model they used and the implications of their findings. The implications of the findings deserve special mention, so they are discussed in detail below.
Generalizability and validity concerns
The paper did not go into much detail discussing the limits of the study’s face validity and ecological validity, or the related topic of its generalizability. With respect to the findings contained in the original paper, there was already some tension between the headline result and the lack of significant results for hypothesis 2, which is arguably the most directly connected with real-world outcomes (since the survey asks about participants’ real-world behaviors). In the original paper, hypothesis 2 was “that ACE-related decision strategies would lead to real-world problematic outcomes in the form of a positive relationship between ACEs and self-reported risk-taking.”
The original paper described a series of regressions – each one focused on a different subscale of the DOSPERT (which assesses risk-taking in financial, health/safety, recreational, ethical, and social domains). Each DOSPERT subscale was entered as the outcome variable of a regression, with ACE score, gender, and age as predictors in each case. None of these regressions yielded significant results. These null findings were only briefly explored in the results and discussion, without the further implications of this being elaborated upon.
The lack of significant findings in those regressions casts doubt on the degree to which the results in favor of hypothesis 1a can be taken to represent something with real-life implications. This point might have been interesting to explore further, especially given that reward networks appear to be involved in risk-taking behaviors in other studies (e.g., Wang et al., 2022). Even if reward pathways were different between the two groups (which was the implied explanation for hypothesis 1a), it seems they weren’t different enough to result in significant findings in the regressions testing hypothesis 2.
This tension might point to a broader problem with the paradigm used in this experiment. We would argue that it has limited face and ecological validity for testing individual differences in adults’ general tendencies towards exploration in everyday life. If so, this would substantially limit the generalizability of the original paper’s results, even if those results had replicated. To be clear, this problem does not uniquely apply to this paper, but to many that use this paradigm.7 We are also far from the first to write about this. For example, Hall-McMaster & Luyckx (2019) pointed out that “current task designs involving random encounters with choice items do not reflect situations in which animals can make use of their knowledge in the environment to encounter items strategically.” Real-life choices between exploration and exploitation involve leveraging experience and expectations about unexplored environments. Decision-makers also understand that these environments are dynamic, potentially offering varying rewards over time and/or in relation to other variables. It may be that simplified tasks (such as the current apple foraging task) are too far removed from practical decision-making to be a representative measure of exploration.
Even setting aside real-world generalizability, it also remains to be seen whether findings from the apple foraging task would consistently generalize to other experimental explore-vs-exploit tasks. Some evidence suggests that task-specific factors can prevent generalizability between different paradigms. An example is given in von Helversen et al. (2018). In that study, 261 participants completed three different paradigms, each designed to study “exploration–exploitation trade-offs.” None of those tasks used the apple-picking paradigm, but all of them were designed to study participants’ tendencies towards exploration. Structural equation modelling suggested that there “was no single, general factor underlying exploration behavior in all tasks, even though individual differences in exploration were stable across the two versions of the same task.” This study is only indirectly suggestive, but it at least raises questions about the degree to which psychological explore-exploit paradigms can specifically isolate and measure tendencies towards exploration, as opposed to also eliciting individual differences related to other (non-exploration-related) tendencies (which could interact with task-specific factors).
Robustness concerns
The original paper could have been clearer if they had also explained the pre-registration deviations and their implications – including the paper’s lower generalizability in the context of the non-robust significant finding. The paper does not discuss the fact that the originally-planned t-tests yield a null result within the rich environment. If this had been discussed, the potential non-robustness of the main results could have been clearer to readers.
Lack of clear explanations for missing data
There were six participants in the original study whose leave thresholds in the rich environment were missing and who had “NA” recorded there instead in the file on OSF. These missing rich environment leave thresholds were not explained in the paper or supplementary materials as far as we could see. An understanding of why that data were missing may have helped with interpreting the original study results.
Comments on model specification
The paper states that the study’s findings “demonstrate the negative impacts on reward-processing that are associated with adversity in childhood.” It also states: “Using computational modeling, we identify that reduced exploration is associated with ACE-exposed individuals underweighting reward feedback, which highlights a cognitive mechanism that may link childhood trauma to the onset and maintenance of psychopathology.” Some readers might interpret these statements as if the authors had ruled out more hypotheses than they actually had.The paper implies that the explanation for the study findings was that those in the high ACEs group were underweighting reward feedback. However, there were other possible explanations.
The original paper’s explanation that they were employing one specific model of learning in this task – and that other models could also have been used – was made quite clear in their methods section. As the original paper notes, the Marginal Value Theorem employed to describe learning in an apple foraging task first introduced by Constantino & Daw (2015) – is “a prominent” one. This, of course, does not imply that the model employed in their analyses was the only model that could have been used. For example, they also noted (in the methods section) that they “compared this model, which uses only a single learning rate for all outcomes, to a model in which the learning rate was split for better-than-expected and poorer-than- expected outcome.” Although that wasn’t covering all the comparisons they said they would make in their pre-registration, they avoided leaving the reader with the false impression that the model tested was the only thing that could have explained the data collected.
Notwithstanding that, the potential for other explanations of participants’ foraging behavior (aside from MVT) was not explained as much as it could have been in the current study. Only one other potential model was mentioned (and the calculations for it were only shown in the supplementary materials). The authors only briefly discussed the possibility of other models explaining the ways in which participants may have been engaging with the task, but this was part of the description of the methods and was not discussed in more detail elsewhere. That is despite the fact that a lot of the later discussion depended on the model on which they chose to focus.
Alternative hypotheses
Beyond the choice of computational model, there are other explanations for the original headline result that can’t be ruled out based on the original study design. Below, we list some examples that could have at least partly contributed to the differences between groups in the original study. Some of these possible explanations were discussed in the original paper, which is noted where applicable.
- Cognitive differences – The study looked at educational attainment as a possible variable that could explain performance differences between the groups, but did not look at cognitive differences. A recent meta-analysis showed small-to-medium negative associations between ACEs and overall cognitive control (g = −0.32), as well as between ACEs and each of the following domains of cognitive control: working memory (g = −0.28), cognitive flexibility (g = −0.28), and inhibitory control (g = −0.32) (Rahapsari et al., 2025).To briefly explore this possible explanation, we included a three-minute cognitive task after the foraging task (and before the ACE questionnaire). We did not find significant differences in the cognitive performance of the two groups in our dataset. This is discussed further in the appendix.
- Cost Sensitivity – The groups could have differed in their sensitivity to costs, in addition to or instead of rewards. The paper acknowledges that the original study varied two things (both rewards and costs) between the two environments, but in its overall conclusions does not address the possibility of costs having contributed. It seems to us that the original study results could have been related to either different reward processing, or different processing of costs, or both, or neither.
- Travel time – We made the travel time between trees consistent between the two environments in our replication in order to remove the potential confounding effect of different costs across environments. But the fact that there was more than one thing varying between environments in the original experiment introduced additional explanations for the original study results which were inadequately explored in the original discussion, and that reduced the clarity of the paper.
- Stress levels – The original paper discusses differences in stress level between the two groups as a possible alternative explanation that could not be ruled out by the study design. To quote from the paper: “We did not control for rates of stress, which mediate the association between ACEs and adult psychopathology (49). State and trait stress have been associated with decreased exploration in a foraging paradigm.” The clarity of the paper is improved by acknowledging this potential confound.
- Undetected confounds – Differences in recruitment methods between the two groups could have potentially introduced other confounding variables we haven’t considered (e.g., different levels of access to online spaces, different socioeconomic backgrounds, and so on). The original study did conduct a comparison between the groups checking for differences in age or educational levels, which showed no significant difference between the groups). This suggests the authors were aware of potential confounds, and took reasonable steps to evaluate whether differences (other than ACE group membership) could have influenced the findings. We include the risk of undetected confounds here because that is always a possibility with study designs of this type.
Other issues relating to clarity
In addition to the generalizability and validity, robustness, and potential alternative explanations, there were a few more minor issues relating to how easily a reader may understand and interpret the paper. The most important of these is the mis-labeling of a key variable used in the paper’s computational model.
As mentioned above, the original paper based their conceptualization of the task and the application of the marginal value theorem (MVT) to it on Constantino & Daw (2015). In that paper, Constantino & Daw introduce a depletion parameter (κ). In the current paper, that parameter is instead called the depletion rate, even though the depletion rate is actually inversely proportional to the depletion parameter. This would introduce unnecessary confusion to readers, since they would wonder why an environment labeled as having a higher depletion “rate” has, in fact, a lower depletion rate. Using the same term as Constantino and Daw (i.e., depletion parameter) could have avoided some of that confusion.
In other words, the paper uses the term “depletion rate” when referring to what the original study called a “depletion parameter,” which had a different meaning (i.e., it is not a synonym for “depletion rate”). When apples depleted faster, the current paper labeled this as having a lower “depletion rate,” which is the direct opposite to what readers would intuit. Instead, the paper could have stayed with the original term of “depletion parameter” and could have thereby avoided that confusion.
The other smaller clarity issues that we identified are discussed in the appendix.
Conclusion
We attempted to replicate a study that had shown that adults with high levels of adverse childhood experiences (ACEs) tend to spend longer picking apples before moving to a new tree in a computerized foraging task, compared to adults with fewer ACEs. This finding was used to infer that people with high ACEs tend to explore less than those with low ACEs. The main finding didn’t replicate in our study, although there was a trend in the same direction as the original experiment.
The paper received a moderate rating for transparency because the experimental materials, analysis code, and data for the study were publicly shared; however, major pre-registration deviations were not disclosed. We also found that several factors limited the paper’s clarity. We concluded that the findings have more limited generalizability than the paper suggests. The paper could also have benefited from more discussion of possible alternative explanations for the findings. Finally, there were some more minor clarity issues, such as mis-labeling a key term.
Acknowledgements
We thank the participants for their valuable time. We also thank the original authorship team, who were responsive, helpful, polite, and always ready to review our replication materials and report when we asked. Many thanks go to Amanda Metskas and Spencer Greenberg for leading Transparent Replications and providing invaluable guidance and feedback throughout this replication.
Authors’ Response
Thank you to the Transparent Replications Team for their important work, though we are of course disappointed that our findings did not replicate in this sample. We will take their feedback on board to improve our Open Science practices in the future.
One potential reason for the lack of replication may be due to the differences in recruitment methods between our original study and the replication. The sample from our 2022 paper were recruited through charities that support individuals for specific traumatic events (e.g., physical or sexual abuse), meaning our sample of individuals with 4 or more ACEs would have had high rates of threatening experiences (as defined in dimensional models of childhood adversity; McLaughlin et al., 2016, Current Directions in Psychological Science). It may be that cases of threatening experiences are lower in the community sample recruited for the replication project and that their high-ACE sample comprised participants reporting more experiences of neglect or family disruption (e.g., parental divorce, having an incarcerated parent). These potential differences between the samples are important to consider as it has been proposed that specific forms of childhood trauma may differentially impact processes relevant to these studies (McLaughlin et al., 2016). However, we recognise this explanation would need empirical testing in future research.
We think the alternative explanations proposed for our findings would be interesting to consider in future longitudinal work on this topic and whether processes such as cognitive differences or cost sensitivity may mediate the association between ACEs and explore/exploit choices in adulthood.
Once again, we thank the Transparent Replications Team for their careful work.
Signed,
Alex Lloyd on behalf of the authors
Purpose of Transparent Replications by Clearer Thinking
Transparent Replications conducts replications and evaluates the transparency of randomly-selected, recently-published psychology papers in prestigious journals, with the overall aim of rewarding best practices and shifting incentives in social science toward more replicable research.
We welcome reader feedback on this report, and input on this project overall.
Appendices
Additional information about transparency ratings
Analysis transparency
| Aspect of analysis transparency | Comments |
|---|---|
| Analysis code | The analysis code and the comment-based explanations of the analyses were available but had major components (such as the generation of Figure 2, and multiple steps for the other analyses) missing. The rest of the analysis code was done by our team, and after that, we were able to successfully reproduce all their original results with their original cleaned dataset. |
Data cleaning | The data cleaning instructions were absent from the public repository. The cleaning instructions were provided when we requested them, but they included many manual steps, which meant that the decision points that the original team faced when cleaning their data were not as transparent as they could have been if an automated cleaning process had been used. As a more minor point, there were also modifications to the original Gorilla materials that had been required to get the study to run, which resulted in requirements to adapt the cleaning steps accordingly. |
Pre-registration deviations in the original study
The following table details the main ways in which the paper deviated from the pre-registration document for the original study.
Unacknowledged deviations
| Quote from the pre-registration | What was done and described in the paper? |
|---|---|
| “Participants with four or more ACEs will be coded as high ACE exposure whereas three or fewer will be coded as low ACE exposure. Independent sample t tests (or Mann-Whitney if parametric assumptions are violated) will then be conducted using the leaving thresholds from the rich and poor-quality environments as the dependent variables.” “We predict the following hypotheses: 1a) Participants with higher rates of adverse childhood experience (ACE) will exploit patches more compared to those in the low ACE group” “We will conduct confirmatory analysis to examine differences in leaving values between environments using a paired sample t test (or a Wilcoxon’s test if parametric assumptions are violated). The independent variable for this analysis will be the task environment (2 levels), while the outcome variable will be the average leaving value for that patch. This will serve to indicate whether there is a significant difference in foraging strategies between environments. We will conduct confirmatory tests of association (Pearson’s correlation or Spearman’s rho if parametric assumptions are violated) to examine the relationship between the number of historic ACEs and: Leaving threshold Deviation from the optimum leaving threshold Learning rate Self-reported risk taking” | Neither t-tests nor Mann-Whitney tests are reported on in the paper. Results from such tests do not appear in the results in the paper or supplementary materials. We have reported on the t-test results in our report above. The authors report ANOVA results despite the fact that their pre-registration did not mention ANOVAs, and they don’t acknowledge any of the deviations between their pre-registered plans and what they did. Apart from the lack of correlation between ACE scores and self-reported risk taking, the other analyses are not mentioned in the paper, including the t-test results (including the null findings in the case of the rich environment) and the non-significant correlation results. |
| “During the task, trials where participants timeout (i.e. do not provide a response in the allocated time) will be excluded, as this does not provide information about participants’ leaving values and is therefore uninformative in the analysis” | The paper did not mention any changes to this rule. But in our further correspondence with the authorship team, they said: “it is important to exclude data from patches (not just trials) where participants timed out.” Based on that correspondence, we noticed that the exclusion criteria changed between pre-registration and the actual analyses. These changes are not mentioned in the paper or supplementary materials. |
| The original pre-registration specified the following about their recruitment methods: “we will recruit roughly equal numbers from word of mouth advertisement and prolific to ensure there are no systematic differences between recruitment methods.” | Based on the description of the methods in the paper, it had sounded to us as if all of the participants in the low-ACE group were recruited via Sona or Prolific instead of via word of mouth. It also sounded as if all or most of the participants in the high-ACE group were recruited via support groups rather than via Sona or Prolific. When we checked in with them about this, the lead author clarified as follows: “Because SONA is a platform that allows advertisement of studies and individuals to register their interest for studies, I had an earlier conception that this was closer to ‘word of mouth’ than a streamlined participant recruitment platform such as Prolific. However, I acknowledge that others may view SONA differently and do not have any issue if you keep the comment in the table as it currently is.” |
Other notes
| Quote from the pre-registration | What was done and described in the paper? |
|---|---|
| In the pre-registration and original paper, the authors explained that they would test the Marginal Value Theorem (MVT) Learning Model (please also see the earlier sections of this report about the study hypotheses). In the pre-registration, the authors also implied that they would test multiple models, by stating the following: “In line with best practice recommendations (see Lee et al., 2019), a log of the model development process will be kept, detailing model alterations and exclusions from the final model comparison.” They also stated that they may test other models as well. More specifically, they said: “As we will be taking a computational modelling approach, we may conduct exploratory analysis using additional models. This will involve introducing further parameters that may explain participants’ performance on the task. For example, exploratory analysis may be conducted on variations of MVT used in the ecology literature, such as Bayesian updating (Marshall et al., 2013). If these models display a greater fit the to the data than MVT, we will conduct follow up analyses to determine whether there are differences between adolescents and adults on key parameters in these models. All additional models will be detailed in a “postregistration” document which will be made publicly available along with the data and analysis scripts for this study” | The steps mentioned in the quote are not mentioned in the paper or pre-registration. To our knowledge, there were no adolescents in this study. It seems that this part of the pre-registration may have been an accidental inclusion carried over from another study, but if so, this has not been noted anywhere that we could find. |
Additional Information about the Methods
Preview of the study
You can preview the study at this link.
The consent form
Below is a copy of the consent form:
Informed Consent Statement
Please read this consent statement carefully before deciding whether to participate.
About this study
Participation will involve playing a virtual apple foraging game where your goal is to explore different foraging patches and gather as many apples as you can. You will have an opportunity to gain additional compensation based on your score in the foraging game.
Participating in this study will take no longer than 25 minutes.
Risks in participating:
The principal disadvantage of participating in this study is the time it will take you to participate in the testing session. After the computerized tasks, you will be asked some questions about your childhood, which might be stressful to read. If these questions cause you distress, you may withdraw from the study at any point.
Benefits of participating:
This research is not intended to benefit you personally. The main benefit of participation is the monetary compensation you’ll receive for participation. (In addition to an initial sum of $4.50 for taking part, you could make up to an additional $3, dependent on your score on the study task. Higher scores on the task will mean you get a bigger payment at the end of the study.)
Confidentiality:
Any information you provide will not be personally linked back to you. Any personally identifying information will be removed and not published. By participating in this study, you are agreeing to have your anonymized responses and data used for research purposes, as well as potentially used in write-ups and/or publications.
Participation and Withdrawal:
Your participation in this study is completely voluntary, and you have the right to withdraw at any time without penalty, though you will not be paid if you do so. To withdraw, simply close this browser tab at any time.
Contact Information:
For general questions about the study or what it involves, or if you have any technical problems relating to completing the questions, please contact us at: replications@clearerthinking.org
If you have questions about your rights as a research participant, contact the Human Research Ethics Committee, HKU (+852 2241-5267). Approval number: EA240437
Additional methodological differences between the original study and the replication
Travel Time
We kept the travel time the same (6 seconds) across the rich and poor environments so that only the reward rate (rather than also the time cost involved) was changing across environments. We did this because, as the authors pointed out in their introduction, it seems useful to vary the reward independent of cost in order to isolate the effects of differences in rewards. We note the original authorship team’s comment on this change: “With regards to the changes you have made to the experiment, I don’t have any concerns about the proposed changes – thank you for checking. However, I would flag that by only changing the reward rate (and not the travel time as well), there is likely to be a smaller effect size of the environment quality (rich versus poor) on participants’ leaving thresholds. Therefore, you may need a larger sample size to detect this effect. However, as this is not the primary aim of the replication then it may not be a concern and your exploratory analysis would be sufficient to examine the difference in leaving thresholds between those with 4 or more ACEs, and those with fewer/no ACEs.”
A note about the number of apples per row
For the visual depiction of how many apples had just been “picked” every time a participant chose to “stay,” we displayed eight apples per row instead of six. Everything else about the visuals was kept the same as the original. We did this just in case having six apples per row had been giving participants a visual cue which encouraged them to prefer a five or six apple leaving threshold.
The original experiment had up to six apples displayed per row (when apples were displayed at each “foraging” turn), which was close to the optimal number of apples after which participants “should” switch trees, on average (for an optimal number of points, according to the equations that the authors theorized that participants’ decisions might be well-modeled by, the optimal threshold was 7.04 in rich environments and 5.07 in poor environments). Our experiment included eight apples per row and yet still showed similar leaving thresholds to the original experiment. This strengthens the original authors’ claim that their decision-making equation can be used to model participants’ decisions, since it appeared to predict behavior even when the maximum number of apples per row was disentangled from the optimal leaving threshold.
The score bug
In the course of setting up the study, we uncovered a bug affecting how the original scores were displayed beyond a certain number of trials. We found that the score displayed to participants became inaccurate after 32 trials (at a given tree) in the rich environment. This seems related to a bug in the task script which caused later trials to refer to incorrect cells in the spreadsheet used to populate score values and stimuli.
For example, choosing to “stay” for the 35th time might display zero apples, but the total score still increased from trial to trial (as if the participant had moved on to a new tree). In light of that bug, we let the original authorship team know and then altered the task script to accurately display the total score in the rich environment regardless of the number of “stay” decisions.
In the course of replicating this study, we discovered a bug affecting how some scores were displayed in the original experiment. In response to the email where we told the original authorship team about this, they said:
“I must admit I haven’t seen the bug affecting the scores in my data, so thank you for bringing this to my attention. My suggestion for fixing this bug would be to i) add additional columns to the spreadsheet to calculate the depletion from scores after 32. To do this, you will need to add three columns for each new score drawn.”
Extending the maximum number of forages
This was done in the process of fixing the score bug that we found in the original experiment. The original experiment forced participants to advance after fewer “stay” decisions. We ensured that all possible trees would reach a forced advance only after every possible tree had passed more than one forage producing zero apples.
Early task completion bug
Some participants experienced a bug which would interrupt the foraging task and direct participants to a screen erroneously displaying a “Task Complete” message, and interfering with redirection toward the cognitive task. This was fixed by including timed screens in the Gorilla builder. As a result, participants occasionally spent a few extra seconds in each environment as Gorilla processed the screen timer transitions. As opposed to an abrupt cut-off exactly seven minutes into a foraging environment, participants who reached the seven-minute mark were allowed to complete the current tree before being advanced to the next environment. Participants who encountered the bug were not included in our data set. It is not clear to us whether this bug did or did not affect any participants in the original study.
Notes on sample size
Regarding sample sizes: as per our pre-registration, using GPower, we calculated the effect size in the result in the original study to be 0.1758631 (for an eta squared of 0.03), and 75% of that effect size is 0.132 (rounded to 3 decimal places).
Putting 0.132 into GPower, along with 2 groups (high and low ACEs) and 2 measures (average patch residency in rich and poor environments respectively) with a correlation between the average patch residency in those 2 environments being 0.70 (rounded to 2 decimal places, based on the data from their original study), we found a total required sample size minimum of 94. This would correspond to 47 people per group. In this project, in cases where our sample size calculations are lower than the original experiment sample size, we tend to default to the higher of the two values (i.e., in this case, the original experiment sample size) as the minimum sample unless there are good reasons not to do so. In other words, we defaulted to being well above the required sample size to have adequate power to find an effect that could have even been smaller than the original study.
The original authors had 47 people in the high ACE group and 98 in the low ACE group for a total of 145 across the two groups. For our replication, we decided to collect data from at least 47 eligible people per group and 145 in total across the two groups.
We stopped data collection after a data check had shown that each group had exceeded the minimum number of eligible participants, and the total number of participants had exceeded 145. Then we conducted the analyses as pre-registered.
Additional Analyses
Exploratory results
Results relatively unchanged with different exclusion criteria
In our pre-registration, we said: “For our supplementary analysis, we may exclude people if they attempted to continue to select “stay” after zero apples had already displayed for at least one trial.” Though this was an optional point, we did check to see how many would be excluded if they attempted to continue to select “stay” after zero apples had already been displayed for at least one trial. It turned out that only two participants were excluded following that criterion, and when we reran the main ANOVA with those two participants removed, we still obtained a non-significant result but with the effect still trending in the expected direction. The main effect of ACE group was F(1,142) = 1.473, p = 0.227. (So our replicability rating would have been the same whether we used our main or supplementary analyses.)
No significant differences in learning rates or cognitive performance between the groups
For all of the following other exploratory findings, Shapiro-Wilk tests showed significant deviations from normality (p < 0.001) so we performed Mann-Whitney U tests.
Learning rates
We checked for differences in alpha values derived from the MVT model described in the paper, for which lower values imply higher learning rates (as explained in the methods section of the original paper). We did not find statistically significant differences. The mean alpha parameter in environment 1 (referred to here as sym_alpha_en1 as in the original study) among those in the high ACE group was 0.389, and in the low ACE group it was 0.345; U = 2126, n1 = 91, n2 = 55, p = 0.129. The mean alpha parameter in environment 2 (sym_alpha_en2 for those in the high ACE group was 0.400, and for those in the low ACE group it was 0.363; U = 2215, n1 = 91, n2 = 55, p = 0.246).
Cognitive task results
In our pre-registration, we wrote: “We will also assess the estimated IQ (based on the scoring methods associated with the screening test we are using from Clearer Thinking) in both the high and low ACE group, and we will conduct an independent t-test comparing IQ estimates between the two groups. If there is a difference or a trend towards a difference between the groups, we may conduct follow-up analyses examining whether IQ correlates with task performance and/or implied learning rate.”
If there had been intelligence differences between groups in the original study (which we cannot rule in or out based on our results), it would have been an open question as to the degree to which factors contributed to the results in that study (e.g., underweighting reward feedback, general cognitive differences, or other factors).
In our replication dataset, we did not achieve the original headline result, so there is less to explain in the first place. However, we still went forward with our comparison, as per our pre-registration. We compared the estimated intelligence quotient (IQ) between the two groups in our dataset. There was no significant difference in the mean normalized scores on the cognitive tasks between those in the high ACE group (M = 105.160, SD = 2.080) and those in the low ACE group (M = 105.860; SD = 2.213); U = 2962, p = 0.064.
Additional notes about clarity
Overall, we gave this paper a Clarity rating of 2.25 stars. The main reasons for this have been outlined in the body of this report. There were some additional (more minor) points that informed this study’s Clarity rating. These are explained below.
- Visual clarity issues: As shown in the images of the task earlier, if participants had not read the experimental instructions carefully, they may have been confused about some aspects of the experiment. For example, participants may have focused on either the number of apples, or the number shown as the cumulative score, or both. Whether they focused on one, the other, or both could have affected their behavior in the experiment.
- Additional terminology issue: The body of this piece explained how one of the parameters was mis-labeled in the paper. There was an additional, less important terminology issue as well: the original paper referred to higher and lower “leave thresholds” in a way that was technically correct but which could be misinterpreted by some readers. In the paper, a “high” leaving threshold referred to the tendency to leave sooner while there were still more apples left, i.e., leave more readily. A “low” leaving threshold referred to the tendency to leave later, when there were fewer apples left, i.e., leave less readily. Some readers might think that a “low” leaving threshold would instead refer to leaving more readily. It may have been preferable for the authors to instead refer to the “average remaining apples per trial” or something else that more literally communicated what the variable in question represented.
- Supplementary table error: Supplementary Table 1 appears to have swapped the labels for the rows for the “dual learning rate” and the “single learning rate” models. The text implies that lower values were obtained for the single learning rate model, which would be consistent with the paper, which also states this. If that’s the case, though, then the table rows that have been mis-labeled.
References
Blais, A. R., & Weber, E. U. (2006). A Domain-Specific Risk-Taking (DOSPERT) scale for adult populations. Judgment and Decision making, 1(1), 33-47.
Constantino, S. M., & Daw, N. D. (2015). Learning the opportunity cost of time in a patch-foraging task. Cognitive, Affective, & Behavioral Neuroscience, 15, 837-853.
Faul, F., Erdfelder, E., Buchner, A., & Lang, A. G. (2009). Statistical power analyses using G* Power 3.1: Tests for correlation and regression analyses. Behavior research methods, 41(4), 1149-1160.
Hall-McMaster, S., & Luyckx, F. (2019). Revisiting foraging approaches in neuroscience. Cognitive, Affective, & Behavioral Neuroscience, 19(2), 225-230.
von Helversen, B., Mata, R., Samanez-Larkin, G. R., & Wilke, A. (2018). Foraging, exploration, or search? On the (lack of) convergent validity between three behavioral paradigms. Evolutionary Behavioral Sciences, 12(3), 152.
Lloyd, A., McKay, R. T., & Furl, N. (2022). Individuals with adverse childhood experiences explore less and underweight reward feedback. Proceedings of the National Academy of Sciences, 119(4), e2109373119.
Rahapsari, S., & Levita, L. (2025). The impact of adverse childhood experiences on cognitive control across the lifespan: A systematic review and meta-analysis of prospective studies. Trauma, Violence, & Abuse, 26(4), 712-733.Wang, M., Zhang, S., Suo, T., Mao, T., Wang, F., Deng, Y., Eickhoff, S., Pan, Y., Jiang, C. & Rao, H. (2022). Risk‐taking in the human brain: An activation likelihood estimation meta‐analysis of the balloon analog risk task (BART). Human brain mapping, 43(18), 5643-5657.
- We asked the authorship team about this. The lead author responded: “Thank you for bringing this to my attention. I do not have a record of reasons for these missing data, so have no additional context to provide.” ↩︎
- The results shown in the table are the ones derived after excluding the six participants in the dataset who had missing leaving thresholds in the rich environment. If those people were instead included, the t-test results would have been different: t(143) = 1.825, p = 0.070. ↩︎
- The original authors already pointed out that varying both depletion rates and travel time represented an issue with the original study. To quote the original paper: “Future research could address this limitation by comparing environments with long and short travel times, while independently manipulating fast and slow depletion rates (e.g., ref. 24). Administering environments more than once (e.g., ref. 50) might further enhance the effect of environment quality on foraging behavior that we observed in the current study.” ↩︎
- As we found out later, in the replication, in which the costs of switching trees were consistently lower across environments, there was no statistically significant difference between the leaving thresholds between those in the high versus low ACE groups (whether we look at rich or poor environments separately or look at the results overall). This could be consistent with sensitivity to costs driving the original results, but since we did not test that hypothesis directly in the replication, this is only speculation at this point. ↩︎
- As per our pre-registration, the analyses involving the cognitive tasks were only relevant to the Clarity rating of this paper, and did not affect the replicability rating at all. ↩︎
- The results shown in the table are the ones derived after excluding the six participants in the dataset who had missing leaving thresholds in the rich environment. If those people were instead included, the t-test results would have been different: t(143) = 1.825, p = 0.070. ↩︎
- Please note that the paradigm has been widely used and cited. The paper introducing it has been cited 279 times since its publication in 2015, according to Google scholar. ↩︎
